
MATLAB: An Introduction with Applications
6th Edition
ISBN: 9781119256830
Author: Amos Gilat
Publisher: John Wiley & Sons Inc
expand_more
expand_more
format_list_bulleted
Related questions
Question
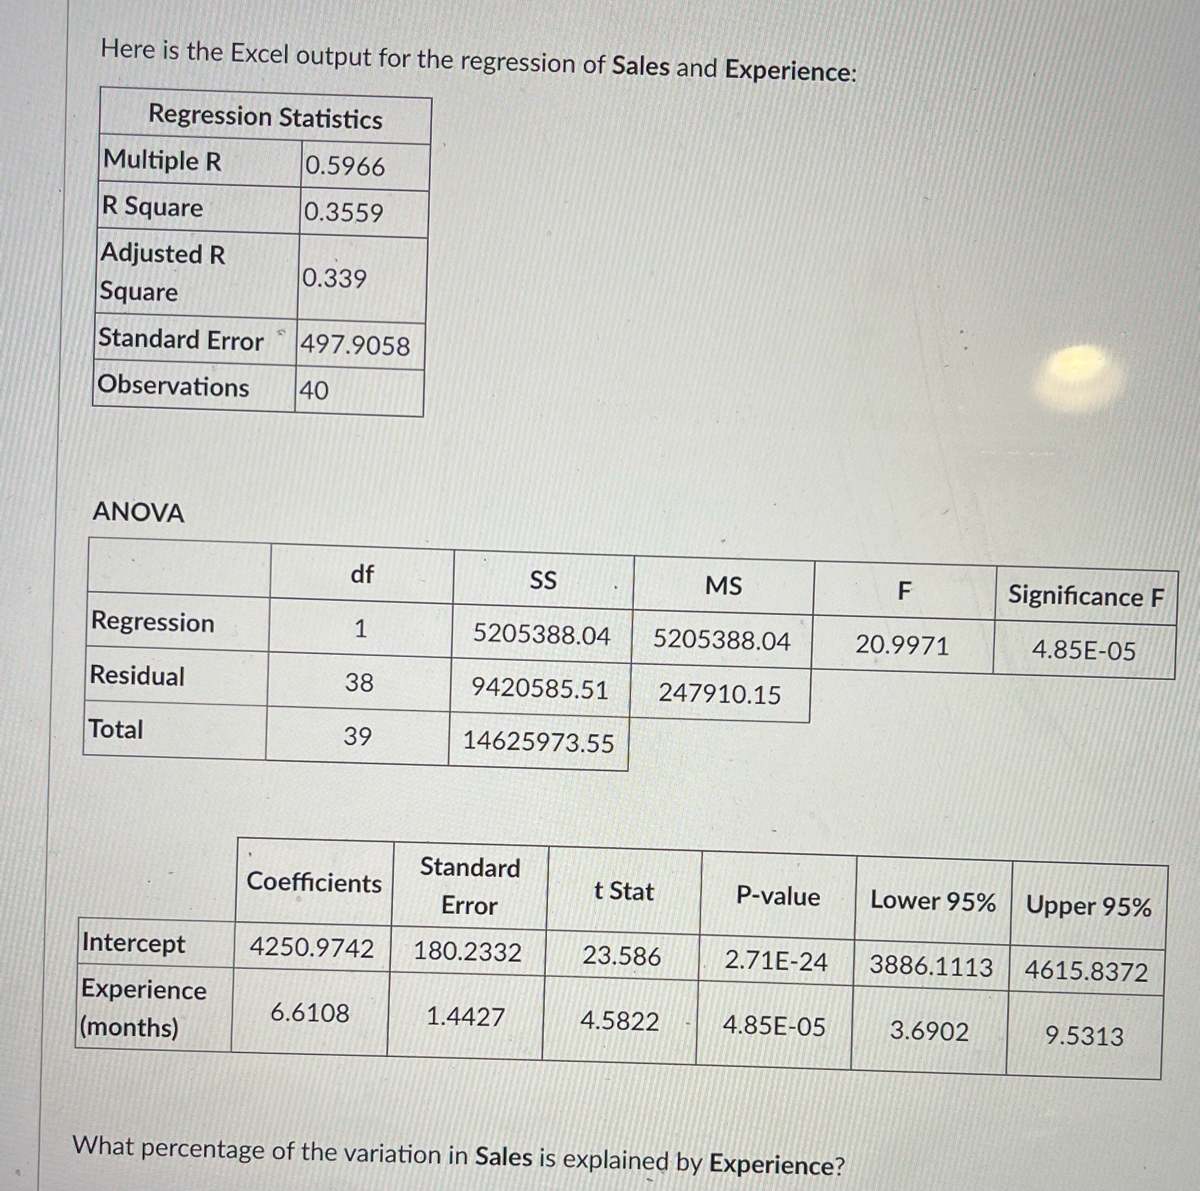

Transcribed Image Text:Here is the Excel output for the regression of Sales and Experience:
Regression Statistics
0.5966
0.3559
Multiple R
R Square
Adjusted R
Square
Standard Error
Observations 40
ANOVA
Regression
Residual
Total
Intercept
Experience
(months)
0.339
497.9058
df
1
38
39
Coefficients
MS
5205388.04 5205388.04
247910.15
6.6108
SS
Standard
Error
4250.9742 180.2332 23.586
9420585.51
14625973.55
1.4427
t Stat
4.5822
P-value
2.71E-24
4.85E-05
What percentage of the variation in Sales is explained by Experience?
F
20.9971
Lower 95% Upper 95%
3886.1113
Significance F
4.85E-05
3.6902
4615.8372
9.5313

Transcribed Image Text:O 59.66%
O 35.59
O 33.9%
O .3559%
Expert Solution
This question has been solved!
Explore an expertly crafted, step-by-step solution for a thorough understanding of key concepts.

This is a popular solution

Trending nowThis is a popular solution!

Step by stepSolved in 2 steps

Knowledge Booster

Similar questions
- It is not possible to calculate the percent of a number that is less than one. True or false?arrow_forwardThe percentage of high school seniors using alcohol decreased from 68.4% in 1975 to 52.4% now. Express this change in two ways: (1) as an absolute difference in terms of percentage points and (2) as a relative difference in terms of percent. (1) The percentage of high school seniors using alcohol decreased by (Round to the nearest tenth as needed.) percentage points. %. (2) The percentage of high school seniors using alcohol decreased by (Round to the nearest tenth as needed.)arrow_forwardThe value of your stock investment decreased by 46% after a stock market crash. What percentage increase in value would the stocks have to rise in order to return to the value they were before the stock market crash?arrow_forward
- Suppose that Melanie is a researcher who wishes to estimate the mean birthweight of full-term babies in her hospital. What is the minimum number of babies should she sample if she wishes to be at least 90% confident that the mean birthweight of the sample is within 225 grams of the the mean birthweight of all babies? Assume that the distribution of birthweights at her hospital is normal with a standard deviation of 600 g.arrow_forwardFor the second quarter of 2016, a company posted a loss of $588 million due to a decline in sales. If this trend were consistent for each month of the quarter, how much loss would be expected for each month?arrow_forward
arrow_back_ios
arrow_forward_ios
Recommended textbooks for you
- MATLAB: An Introduction with ApplicationsStatisticsISBN:9781119256830Author:Amos GilatPublisher:John Wiley & Sons Inc
 Probability and Statistics for Engineering and th...StatisticsISBN:9781305251809Author:Jay L. DevorePublisher:Cengage Learning
 Statistics for The Behavioral Sciences (MindTap C...StatisticsISBN:9781305504912Author:Frederick J Gravetter, Larry B. WallnauPublisher:Cengage Learning
  Elementary Statistics: Picturing the World (7th E...StatisticsISBN:9780134683416Author:Ron Larson, Betsy FarberPublisher:PEARSON
 The Basic Practice of StatisticsStatisticsISBN:9781319042578Author:David S. Moore, William I. Notz, Michael A. FlignerPublisher:W. H. Freeman
 Introduction to the Practice of StatisticsStatisticsISBN:9781319013387Author:David S. Moore, George P. McCabe, Bruce A. CraigPublisher:W. H. Freeman
MATLAB: An Introduction with Applications
Statistics
ISBN:9781119256830
Author:Amos Gilat
Publisher:John Wiley & Sons Inc
Probability and Statistics for Engineering and th...
Statistics
ISBN:9781305251809
Author:Jay L. Devore
Publisher:Cengage Learning
Statistics for The Behavioral Sciences (MindTap C...
Statistics
ISBN:9781305504912
Author:Frederick J Gravetter, Larry B. Wallnau
Publisher:Cengage Learning
Elementary Statistics: Picturing the World (7th E...
Statistics
ISBN:9780134683416
Author:Ron Larson, Betsy Farber
Publisher:PEARSON
The Basic Practice of Statistics
Statistics
ISBN:9781319042578
Author:David S. Moore, William I. Notz, Michael A. Fligner
Publisher:W. H. Freeman
Introduction to the Practice of Statistics
Statistics
ISBN:9781319013387
Author:David S. Moore, George P. McCabe, Bruce A. Craig
Publisher:W. H. Freeman