MATLAB: An Introduction with Applications
6th Edition
ISBN: 9781119256830
Author: Amos Gilat
Publisher: John Wiley & Sons Inc
expand_more
expand_more
format_list_bulleted
Concept explainers
Topic Video
Question

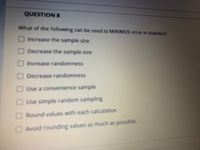
Transcribed Image Text:QUESTION 8
What of the following can be used to MINIMIZE error in statistics?
OIncrease the sample size
ODecrease the sample size
OIncrease randomness
ODecrease randomness
O Use a convenience sample
OUse simple random sampling
ORound values with each calculation
OAvoid rounding values as much as possible.
Expert Solution
This question has been solved!
Explore an expertly crafted, step-by-step solution for a thorough understanding of key concepts.
This is a popular solution
Trending nowThis is a popular solution!
Step by stepSolved in 2 steps

Knowledge Booster
Learn more about
Need a deep-dive on the concept behind this application? Look no further. Learn more about this topic, statistics and related others by exploring similar questions and additional content below.Similar questions
- Please check picture and answer with detail explaination.arrow_forwardLet's examine the mean of the numbers 1, 2, 3, 4, 5, 6, 7, and 8 by drawing samples from these values, calculating the mean of each sample, and then considering the sampling distribution of the mean. To do this, suppose you perform an experiment in which you roll an eight-sided die two times (or equivalently, roll two eight-sided dice one time) and calculate the mean of your sample. Remember that your population is the numbers 1, 2, 3, 4, 5, 6, 7, and 8. The true mean (µ) of the numbers 1, 2, 3, 4, 5, 6, 7, and 8 is , and the true standard deviation (o) is The number of possible different samples (each of size n = 2) is the number of possibilities on the first roll (8) times the number of possibilities on the second roll (also 8), or 8(8) = 64. If you collected all of these possible samples, the mean of your sampling distribution of means (µM) would equal and the standard deviation of your sampling distribution of means (that is, the standard error or ɑm) would be The following chart…arrow_forwardPlease answer the questions carefully to get the correct answers by using the table of flights.arrow_forward
- To get an unbiased sample variance, we divide by instead of which would give us a estimate of the variance.arrow_forwardAnswers only. Thank you An instructor recorded the following number of correct items (in a quiz with 10 questions) for the 12 students present: 7, 4, 2, 2, 2, 9, 10, 6, 7, 3, 8, 5. What is the level of measurement of the data obtained?* a. Ordinal b. Ratio c. Interval d. Nominal 2. The purpose of stratified random sampling is to make certain that* a. the sample is more representative of the target population than the accessible population. b. the participants chosen for the study are the ones most likely to react to the treatment. c. every member of the population has an equal chance of being selected for the sample. d. the sample proportionately represents individuals from different categories of the population 3. In a simple random sample, a. each member in the population has a chance of being included in the sample. b. not all members in the population are given the chance of being selected. c. each…arrow_forwardWhat is the symbol for the sample variance?arrow_forward
- Answer #1A and #1B 1A. Which of the following is NOT true about cluster random sampling? Choose below: Sampling frame is the list of elements in the selected clusters. It is included in our sample all elements in the selected clusters. The clusters should ideally reflect the profile of the population. The population is divided into clusters and then take a sample of clusters. 1B. Systematic sampling is convenient to use in Statistics EXCEPT: Choose below: The sampling procedure does not require a randomization mechanism. We do not need a frame in selecting the elements. It is easy to get the sample elements since we get every kth element. Transportation cost is low.arrow_forwardExplain the procedure to obtain a representative sample Write a short note on each of the following: Simple Random sampling Systematic sampling Stratified sampling Cluster sampling Multi-Stage sampling Convenience sampling Judgment sampling Snowball/Referral sampling Quota samplingarrow_forward
arrow_back_ios
arrow_forward_ios
Recommended textbooks for you
 MATLAB: An Introduction with ApplicationsStatisticsISBN:9781119256830Author:Amos GilatPublisher:John Wiley & Sons Inc
 Probability and Statistics for Engineering and th...StatisticsISBN:9781305251809Author:Jay L. DevorePublisher:Cengage Learning
 Statistics for The Behavioral Sciences (MindTap C...StatisticsISBN:9781305504912Author:Frederick J Gravetter, Larry B. WallnauPublisher:Cengage Learning
 Elementary Statistics: Picturing the World (7th E...StatisticsISBN:9780134683416Author:Ron Larson, Betsy FarberPublisher:PEARSON
 The Basic Practice of StatisticsStatisticsISBN:9781319042578Author:David S. Moore, William I. Notz, Michael A. FlignerPublisher:W. H. Freeman
 Introduction to the Practice of StatisticsStatisticsISBN:9781319013387Author:David S. Moore, George P. McCabe, Bruce A. CraigPublisher:W. H. Freeman

MATLAB: An Introduction with Applications
Statistics
ISBN:9781119256830
Author:Amos Gilat
Publisher:John Wiley & Sons Inc

Probability and Statistics for Engineering and th...
Statistics
ISBN:9781305251809
Author:Jay L. Devore
Publisher:Cengage Learning

Statistics for The Behavioral Sciences (MindTap C...
Statistics
ISBN:9781305504912
Author:Frederick J Gravetter, Larry B. Wallnau
Publisher:Cengage Learning

Elementary Statistics: Picturing the World (7th E...
Statistics
ISBN:9780134683416
Author:Ron Larson, Betsy Farber
Publisher:PEARSON

The Basic Practice of Statistics
Statistics
ISBN:9781319042578
Author:David S. Moore, William I. Notz, Michael A. Fligner
Publisher:W. H. Freeman

Introduction to the Practice of Statistics
Statistics
ISBN:9781319013387
Author:David S. Moore, George P. McCabe, Bruce A. Craig
Publisher:W. H. Freeman