MATLAB: An Introduction with Applications
6th Edition
ISBN: 9781119256830
Author: Amos Gilat
Publisher: John Wiley & Sons Inc
expand_more
expand_more
format_list_bulleted
Question
thumb_up100%

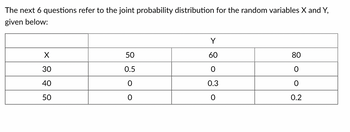
Transcribed Image Text:The next 6 questions refer to the joint probability distribution for the random variables X and Y,
given below:
X
30
40
50
50
0.5
0
0
Y
60
O
0.3
0
80
0
0
0.2

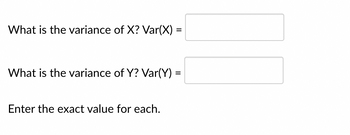
Transcribed Image Text:What is the variance of X? Var(X) =
What is the variance of Y? Var(Y) =
Enter the exact value for each.
Expert Solution
This question has been solved!
Explore an expertly crafted, step-by-step solution for a thorough understanding of key concepts.
This is a popular solution
Trending nowThis is a popular solution!
Step by stepSolved in 5 steps

Knowledge Booster
Similar questions
- If r = +0.2 for 'Age' versus 'Hours spent on social media', what is your conclusion? There is a weak/no covariance between the two variables There is a moderate covariance between the two variables There is a moderate correlation between the two variables There is a weak/no correlation between the two variablesarrow_forward2 Please helparrow_forwardA correlation of r = – 0.95 is stronger than r = + 0.70. true or false?arrow_forward
- What does a correlation coefficient of 2 indicate? There is a weak relationship between the two quantitative variables. It indicates a calculation error, as the correlation coefficient cannot be 2. There is a strong relationship between the two quantitative variables. It indicates a non-linear relationship between the two quantitative variables. There is no linear relationship between the two quantitative variables.arrow_forwardWhen do we know when the variances are similar when using Levene’s test? when the probability for the score is .≠05 when the probability for the score is .>05 when the probability for the score is .=05 when the probability for the score is .<05arrow_forwarddiscuss how the coefficient of determination and the coefficient of correlation are related and how you would use them in regression analysisarrow_forward
- What is the residual?arrow_forwardA random sample of 930 in size is taken from a population with a mean of 6250 and unknown variance. The sample variance was found out to be 910. (a) Find the point estimate of the population variance. i (b) Find the mean of the sampling distribution of the sample mean. iarrow_forwardA researcher is studying the intensity of hurricanes that entered the Gulf of Mexico between 1975-2015 and the average water temperature of the Gulf of Mexico at the hurricane's peak strength. What is the independent and dependent variable in this study?arrow_forward
- Suppose Y = 6x-8, where x is a random variable with mean 2 and a variance of 4/3. Determine the variance of the random variable yarrow_forwardThe Mean of Binomial distribution is 3 and variance is- · Find 4 (i) the value of n (ii) p ( x 21 ) (iii) p (x<7 )arrow_forward/Skip/1 A beverage company has two bottling plants in different parts of the world. To insure uniformity in their product, the variances of the weights of the bottles at the two plants should be equal. But Stephanie, the company's vice president of quality assurance, suspects that the variance at bottling plant A is more than the variance at bottling plant B. To test her suspicions, Stephanie samples 37 bottles from bottling plant A and 33 bottles from bottling plant B, with the following results (in ounces): Bottling Plant A: 12.4, 12.4, 13.4, 14.3, 12.7, 12.7, 13.7, 12.4, 12.8, 12.4, 12.9, 12.7, 12.8, 13.3, 13.8, 12.7, 12.4, 11.9, 12.9, 13, 13.1, 12.4, 12.7, 12.6, 12.5, 13.3, 12.2, 13.3, 12.8, 12.7, 13.2, 13.1, 11.7, 13, 12.3, 13.1, 12.4 Bottling Plant B: 12.9, 12, 13.4, 12.4, 12.4, 12.9, 12.7, 12.1, 11.4, 13.1, 14.1, 12.5, 12.7, 11.5, 12.3, 12.7, 13.7, 12.6, 13.9, 12.7, 12, 12.5, 11.7, 13.6, 11.4, 13.6, 14, 12, 11.5, 12, 11.7, 13, 11.8 Perform a hypothesis test using a 3% level of…arrow_forward
arrow_back_ios
SEE MORE QUESTIONS
arrow_forward_ios
Recommended textbooks for you
 MATLAB: An Introduction with ApplicationsStatisticsISBN:9781119256830Author:Amos GilatPublisher:John Wiley & Sons Inc
 Probability and Statistics for Engineering and th...StatisticsISBN:9781305251809Author:Jay L. DevorePublisher:Cengage Learning
 Statistics for The Behavioral Sciences (MindTap C...StatisticsISBN:9781305504912Author:Frederick J Gravetter, Larry B. WallnauPublisher:Cengage Learning
 Elementary Statistics: Picturing the World (7th E...StatisticsISBN:9780134683416Author:Ron Larson, Betsy FarberPublisher:PEARSON
 The Basic Practice of StatisticsStatisticsISBN:9781319042578Author:David S. Moore, William I. Notz, Michael A. FlignerPublisher:W. H. Freeman
 Introduction to the Practice of StatisticsStatisticsISBN:9781319013387Author:David S. Moore, George P. McCabe, Bruce A. CraigPublisher:W. H. Freeman

MATLAB: An Introduction with Applications
Statistics
ISBN:9781119256830
Author:Amos Gilat
Publisher:John Wiley & Sons Inc

Probability and Statistics for Engineering and th...
Statistics
ISBN:9781305251809
Author:Jay L. Devore
Publisher:Cengage Learning

Statistics for The Behavioral Sciences (MindTap C...
Statistics
ISBN:9781305504912
Author:Frederick J Gravetter, Larry B. Wallnau
Publisher:Cengage Learning

Elementary Statistics: Picturing the World (7th E...
Statistics
ISBN:9780134683416
Author:Ron Larson, Betsy Farber
Publisher:PEARSON

The Basic Practice of Statistics
Statistics
ISBN:9781319042578
Author:David S. Moore, William I. Notz, Michael A. Fligner
Publisher:W. H. Freeman

Introduction to the Practice of Statistics
Statistics
ISBN:9781319013387
Author:David S. Moore, George P. McCabe, Bruce A. Craig
Publisher:W. H. Freeman