MATLAB: An Introduction with Applications
6th Edition
ISBN: 9781119256830
Author: Amos Gilat
Publisher: John Wiley & Sons Inc
expand_more
expand_more
format_list_bulleted
Question
thumb_up100%

Transcribed Image Text:What is the value of the intercept for the
regression equation?

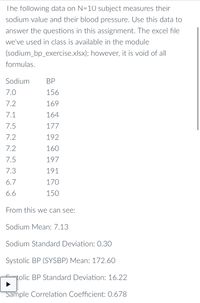
Transcribed Image Text:The following data on N=10 subject measures their
sodium value and their blood pressure. Use this data to
answer the questions in this assignment. The excel file
we've used in class is available in the module
(sodium_bp_exercise.xlsx); however, it is void of all
formulas.
Sodium
BP
7.0
156
7.2
169
7.1
164
7.5
177
7.2
192
7.2
160
7.5
197
7.3
191
6.7
170
6.6
150
From this we can see:
Sodium Mean: 7.13
Sodium Standard Deviation: 0.30
Systolic BP (SYSBP) Mean: 172.60
tolic BP Standard Deviation: 16.22
Sample Correlation Coefficient: 0.678
Expert Solution
This question has been solved!
Explore an expertly crafted, step-by-step solution for a thorough understanding of key concepts.
Step by stepSolved in 2 steps with 3 images

Knowledge Booster
Similar questions
- A sports-equipment researcher was interested in the relationship between the speed of a golf club (in feet per second) and the distance a golf ball travels (in yards). Information was collected on several golfers and was used to obtain the regression equation ŷ = 2x - 106, where x represents the club speed and ŷ is the predicted distance. Which statement best describes the meaning of the slope of the regression line? For each increase in distance by 1 yard, the predicted club speed increases by 2 ft/sec. For each increase in distance by 1 yard, the predicted club speed decreases by 106 ft/sec. For each increase in club speed by 1 ft/sec, the predicted distance increases by 2 yards. For each increase in club speed by 1 ft/sec, the predicted distance decreases by 106 yards.arrow_forwardWhat are the interpretations of the Y intercept and the slopes in a multiple regression model?arrow_forwardWould the regression in Equation be useful for predicting test scoresin a school district in Massachusetts? Why or why not?arrow_forward
- Provide an example of a research project in your hometown where you would choose to use linear regression. What variable would be your Y-score, and what variable would be your X-score? What does a regression line represent? What is the standard error of estimate?arrow_forwardA business analyst found a linear relationship between the predicted profit (in thousands of dollars) with the amount of employees hired (think of the units as per person). The resulting regression equation and coefficient of determination were found to be: ŷ = 10 + 4.5x R² = 72% a) Interpret the slope and y-intercept using the guidelines learned in class. b) Find the predicted profit when the you hire 5 employees. c) Suppose that the true profit when 5 employees are hired is $42 thousand dollars. Find the residual. d) What is the correlation coefficient? Round to three decimal places. e) What is the strength of the correlation coefficient?arrow_forwardWhat's true about the first differences and slope for a linear equation?arrow_forward
- How to know if obtaining a regression equation for the data appear reasonable?arrow_forwardData was collected for a regression analysis comparing car weight and fuel consumption. b0 was found to be 32.7, b1 was found to be -7.6, and R2 was found to be 0.86. Interpret the y-intercept of the line. On average, each one unit increase in the weight of a car decreases its ful consumption by 7.6 units. On average, when x=0, a car gets -7.6 miles per gallon. On average, when x=0, a car gets 32.7 miles per gallon. On average, each one unit increase in the weight of a car increases its fuel comsumption by 32.7 units. We should not interpret the y-intercept in this problem.arrow_forwardIn 2012, the CDC published data on the average weight of American female children by year. Using ages 1−7 of this data, researchers made a linear regression with age in years as the x variable and weight in pounds as the y variable. The equation of the line of best fit is yˆ=5.78x+17.56. According to the line of best fit, what would you predict the weight would be for a 14-year-old female? Is it reasonable to use this line of best fit to make this prediction?arrow_forward
arrow_back_ios
arrow_forward_ios
Recommended textbooks for you
 MATLAB: An Introduction with ApplicationsStatisticsISBN:9781119256830Author:Amos GilatPublisher:John Wiley & Sons Inc
 Probability and Statistics for Engineering and th...StatisticsISBN:9781305251809Author:Jay L. DevorePublisher:Cengage Learning
 Statistics for The Behavioral Sciences (MindTap C...StatisticsISBN:9781305504912Author:Frederick J Gravetter, Larry B. WallnauPublisher:Cengage Learning
 Elementary Statistics: Picturing the World (7th E...StatisticsISBN:9780134683416Author:Ron Larson, Betsy FarberPublisher:PEARSON
 The Basic Practice of StatisticsStatisticsISBN:9781319042578Author:David S. Moore, William I. Notz, Michael A. FlignerPublisher:W. H. Freeman
 Introduction to the Practice of StatisticsStatisticsISBN:9781319013387Author:David S. Moore, George P. McCabe, Bruce A. CraigPublisher:W. H. Freeman

MATLAB: An Introduction with Applications
Statistics
ISBN:9781119256830
Author:Amos Gilat
Publisher:John Wiley & Sons Inc

Probability and Statistics for Engineering and th...
Statistics
ISBN:9781305251809
Author:Jay L. Devore
Publisher:Cengage Learning

Statistics for The Behavioral Sciences (MindTap C...
Statistics
ISBN:9781305504912
Author:Frederick J Gravetter, Larry B. Wallnau
Publisher:Cengage Learning

Elementary Statistics: Picturing the World (7th E...
Statistics
ISBN:9780134683416
Author:Ron Larson, Betsy Farber
Publisher:PEARSON

The Basic Practice of Statistics
Statistics
ISBN:9781319042578
Author:David S. Moore, William I. Notz, Michael A. Fligner
Publisher:W. H. Freeman

Introduction to the Practice of Statistics
Statistics
ISBN:9781319013387
Author:David S. Moore, George P. McCabe, Bruce A. Craig
Publisher:W. H. Freeman