
MATLAB: An Introduction with Applications
6th Edition
ISBN: 9781119256830
Author: Amos Gilat
Publisher: John Wiley & Sons Inc
expand_more
expand_more
format_list_bulleted
Related questions
Question
what is the standard deviation of these numbers
5, 15, 20, 40, 35
also show the formula i need please. thank you .

Transcribed Image Text:2:03
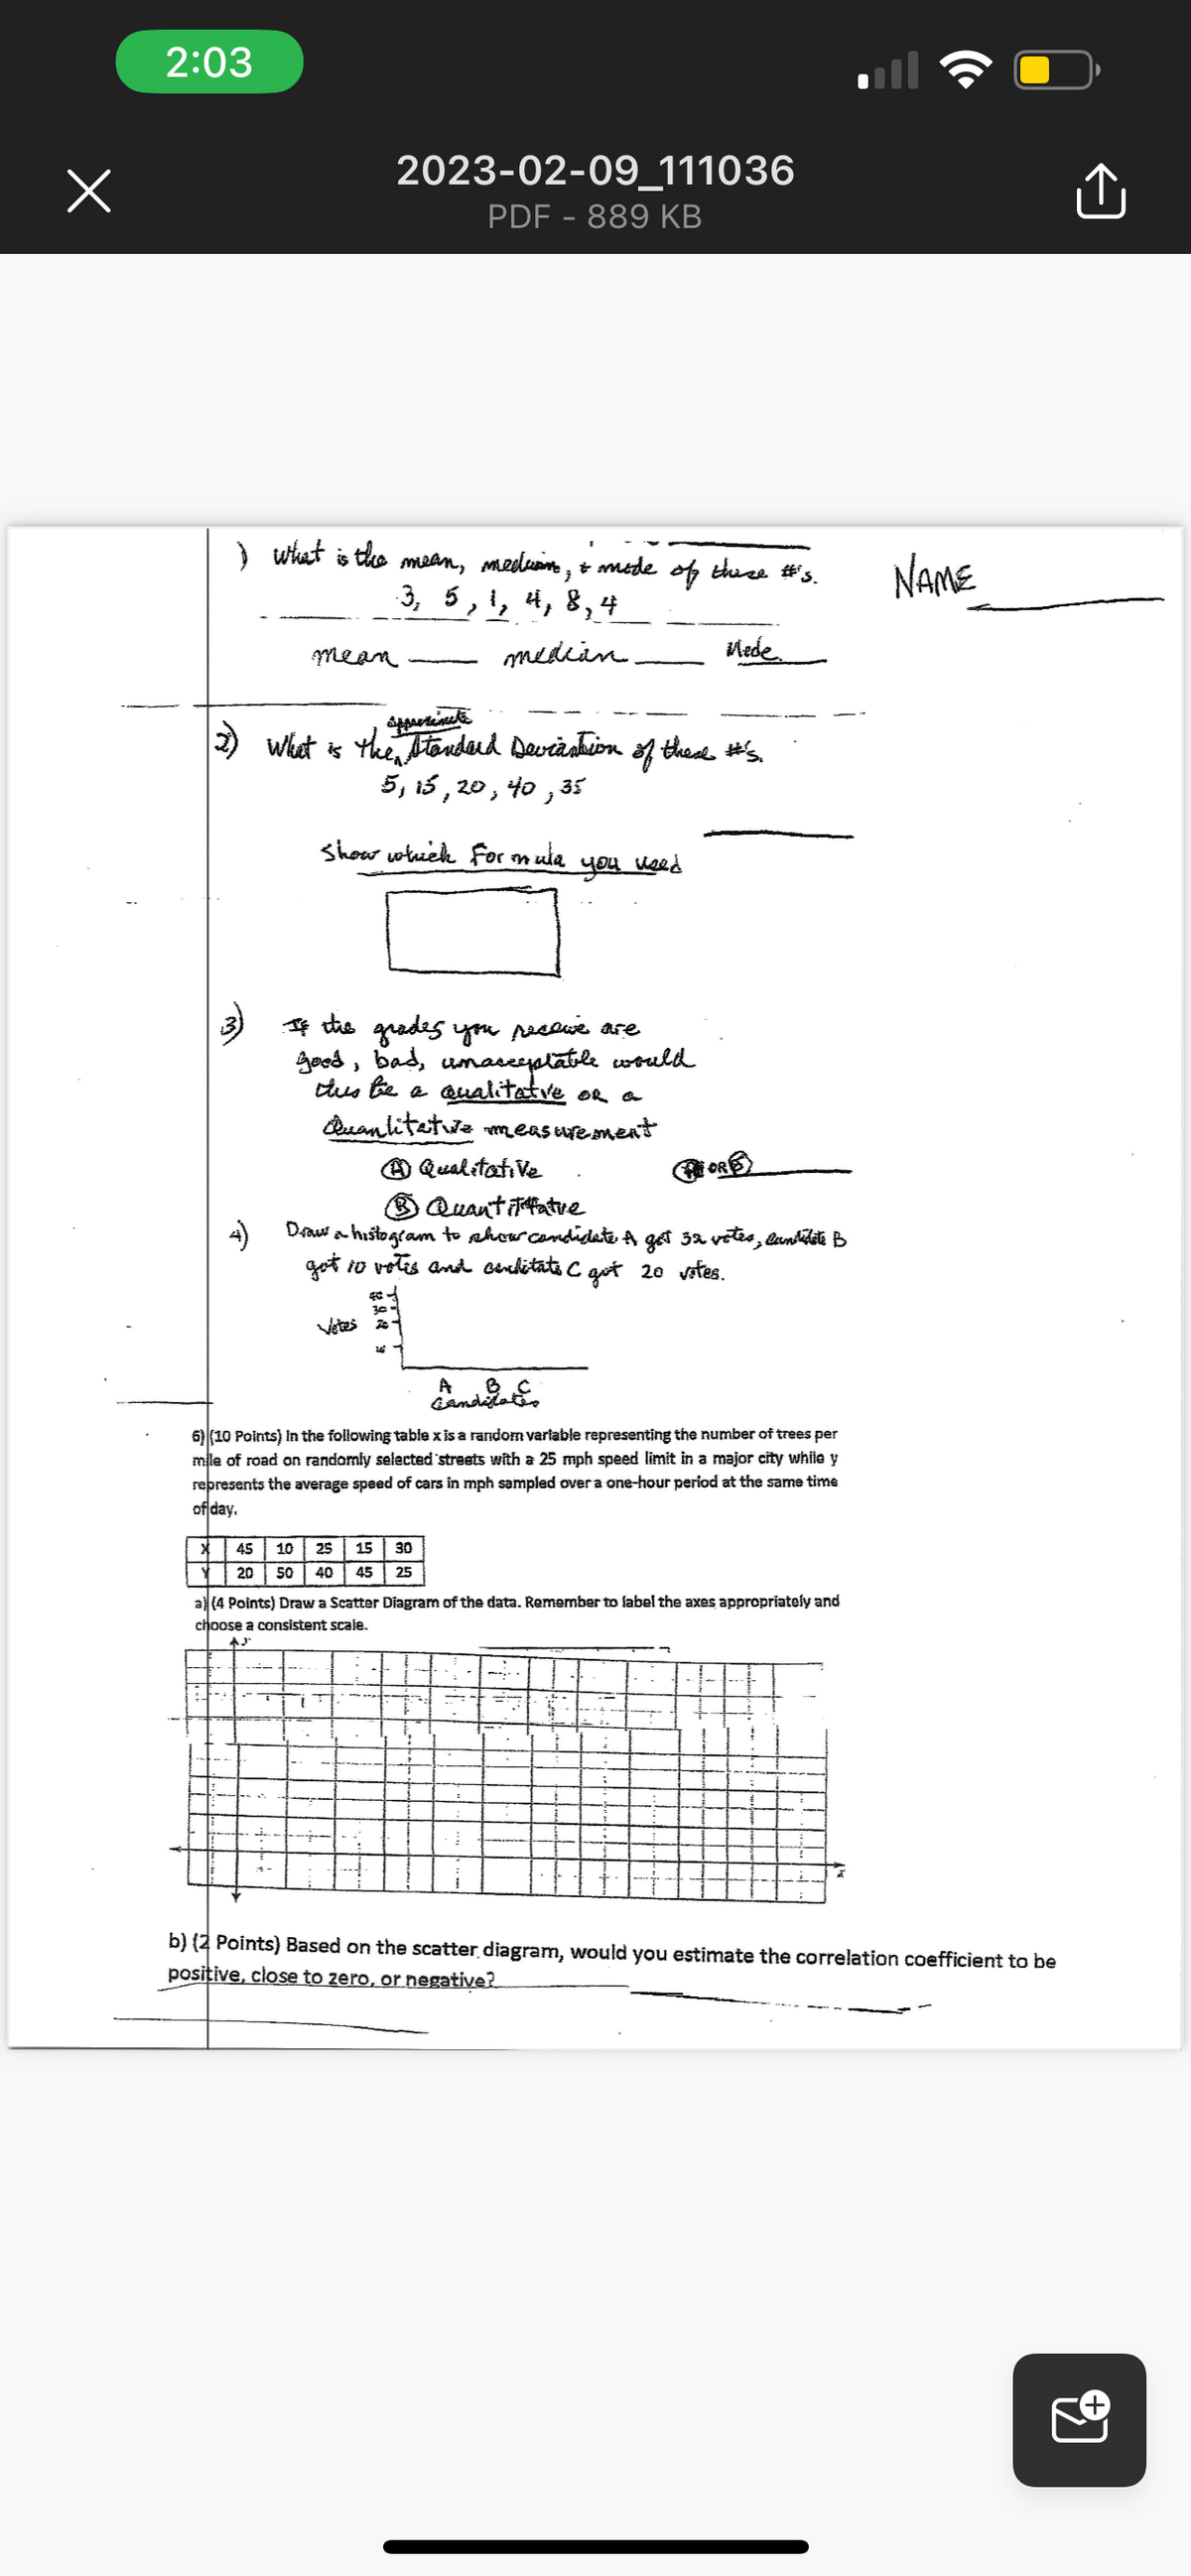
I what is the mean, mediam, & mode of these #'s.
-3, 5, 1, 4, 8, 4
median.
mean
2023-02-09_111036
PDF - 889 KB
spperimete
(2) What is the standard Deviantion of these #'s.
5, 15, 20, 40,35
show which for mula
If the grades you receive are
good, bad, unacceptable would
dus be a qualitative or a
Quantitative measurement
Ⓒ Qualitative
40
30
1
you need
Quantitative
Draw a histogram to show candidate. A got 32 votes, Candidate B
got io votis and cenfitats C gut 20 vites.
X 45 10
25 15 30
Y 20 50 40 45 25
Mede.
A
Bater
Candidates
6) (10 Points) in the following table x is a random variable representing the number of trees per
mile of road on randomly selected streets with a 25 mph speed limit in a major city while y
represents the average speed of cars in mph sampled over a one-hour period at the same time
of day.
PORE
a) (4 Points) Draw a Scatter Diagram of the data. Remember to label the axes appropriately and
choose a consistent scale.
b) (2 Points) Based on the scatter diagram, would
positive, close to zero, or negative?
NAME
estimate the correlation coefficient to be
Û
9
Expert Solution
This question has been solved!
Explore an expertly crafted, step-by-step solution for a thorough understanding of key concepts.

Step by stepSolved in 2 steps

Knowledge Booster

Similar questions
- Ali scores 70 on Calculus-1 course with a class mean of 68 and a standard deviation of 2, and he scores 68 on Introduction to Operating with a class average of 60 and a standard deviation of 2. In which test did he perform well? Explainarrow_forwardDetermine the range, mean, and standard deviation of the data set. {9,5,9,17,17,16,3,8} Please note that I did submit this question earlier but was unable to recognize the answers so I would appreciate it if it the answers are written clearly. Thank youarrow_forwardPls help ASAParrow_forward
- What value should go in the overlap of the two circles? (that's where the 'X' is). Explain your reasoningarrow_forwardPlease answer the questions as soon as possible. Don’t need to explain everything step by step just solve the questions do the math only.arrow_forwardA professor know that her statistics students' final exam scores have a mean of 79 and a standard deviation of 12.8. In his class, an "A" is any exam score of 90 or higher. This quarter she has 23 students in her class. Wht is the probability that 6 students or more will score an "A" on the final exam?arrow_forward
arrow_back_ios
arrow_forward_ios
Recommended textbooks for you
- MATLAB: An Introduction with ApplicationsStatisticsISBN:9781119256830Author:Amos GilatPublisher:John Wiley & Sons Inc
 Probability and Statistics for Engineering and th...StatisticsISBN:9781305251809Author:Jay L. DevorePublisher:Cengage Learning
 Statistics for The Behavioral Sciences (MindTap C...StatisticsISBN:9781305504912Author:Frederick J Gravetter, Larry B. WallnauPublisher:Cengage Learning
  Elementary Statistics: Picturing the World (7th E...StatisticsISBN:9780134683416Author:Ron Larson, Betsy FarberPublisher:PEARSON
 The Basic Practice of StatisticsStatisticsISBN:9781319042578Author:David S. Moore, William I. Notz, Michael A. FlignerPublisher:W. H. Freeman
 Introduction to the Practice of StatisticsStatisticsISBN:9781319013387Author:David S. Moore, George P. McCabe, Bruce A. CraigPublisher:W. H. Freeman
MATLAB: An Introduction with Applications
Statistics
ISBN:9781119256830
Author:Amos Gilat
Publisher:John Wiley & Sons Inc
Probability and Statistics for Engineering and th...
Statistics
ISBN:9781305251809
Author:Jay L. Devore
Publisher:Cengage Learning
Statistics for The Behavioral Sciences (MindTap C...
Statistics
ISBN:9781305504912
Author:Frederick J Gravetter, Larry B. Wallnau
Publisher:Cengage Learning
Elementary Statistics: Picturing the World (7th E...
Statistics
ISBN:9780134683416
Author:Ron Larson, Betsy Farber
Publisher:PEARSON
The Basic Practice of Statistics
Statistics
ISBN:9781319042578
Author:David S. Moore, William I. Notz, Michael A. Fligner
Publisher:W. H. Freeman
Introduction to the Practice of Statistics
Statistics
ISBN:9781319013387
Author:David S. Moore, George P. McCabe, Bruce A. Craig
Publisher:W. H. Freeman