
MATLAB: An Introduction with Applications
6th Edition
ISBN: 9781119256830
Author: Amos Gilat
Publisher: John Wiley & Sons Inc
expand_more
expand_more
format_list_bulleted
Related questions
Question
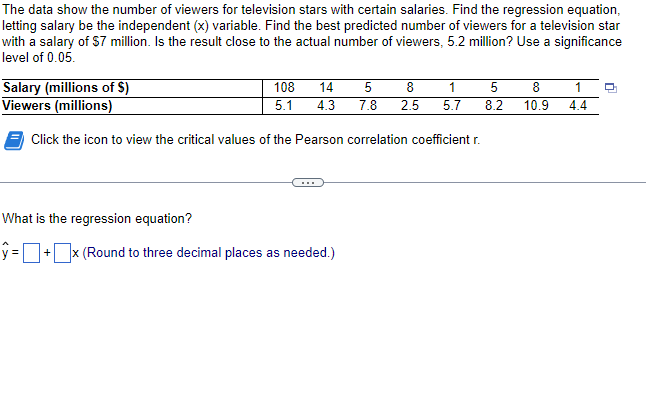

Transcribed Image Text:The data show the number of viewers for television stars with certain salaries. Find the regression equation,
letting salary be the independent (x) variable. Find the best predicted number of viewers for a television star
with a salary of $7 million. Is the result close to the actual number of viewers, 5.2 million? Use a significance
level of 0.05.
Salary (millions of $)
108 14 5 8
5.1 4.3 7.8 2.5
Viewers (millions)
Click the icon to view the critical values of the Pearson correlation coefficient r.
What is the regression equation?
y=+x (Round to three decimal places as needed.)
X
1
1 5 8
5.7 8.2 10.9 4.4
Expert Solution
This question has been solved!
Explore an expertly crafted, step-by-step solution for a thorough understanding of key concepts.

This is a popular solution

Trending nowThis is a popular solution!

Step by stepSolved in 2 steps with 4 images

Knowledge Booster

Similar questions
- A regression was run to determine if there is a relationship between hours of TV watched per day (x) and number of situps a person can do (y). The results of the regression were: y=ax+b a=-1.227 b=32.3 r2=0.494209 r=-0.703 Use this to predict the number of situps a person who watches 7.5 hours of TV can do (to one decimal place)arrow_forwardInterpret the regression coefficient of X3 in relation to the Y ( X3 unit is mile) Y = 58.286 + 13.7604 * X3arrow_forwardA regression was run to determine if there is a relationship between hours of TV watched per day (x) and number of situps a person can do (y).The results of the regression were:y=ax+b a=-1.289 b=28.463 r2=0.381924 r=-0.618 Use this to predict the number of situps a person who watches 2.5 hours of TV can do (to one decimal place)arrow_forward
- A data set whose original x values ranged from 120 through 351 was used to generate a regression equation of ŷ=0.06x + 14.2. Use the regression equation to predict the value of y when x=110.arrow_forwardNeed help If my outer regression equation is Weight= -191.891 + 5.06 (Height) How do I find the estimated weight LBS for an individual with height 76 inches?arrow_forwardUse the regression equation = 12.36 + 4.745X to find the predicted value when x = 3.25arrow_forward
- A regression was run to determine if there is a relationship between hours of TV watched per day (x) and number of situps a person can do (y). The results of the regression were: y=ax+b a=-1.375 b=26.852 r2=0.395641 r=-0.629 Use this to predict the number of situps a person who watches 14 hours of TV can do (to one decimal place)arrow_forwardPlease only answer “d” and “e” as I already have the other parts filled out. Thank you!arrow_forwardA regression was run to determine if there is a relationship between hours of TV watched per day (x) and number of situps a person can do (y).The results of the regression were: y=ax+b a=-0.609 b=27.646 r2=0.910116 r=-0.954 Use this to predict the number of situps a person who watches 12 hours of TV can do (to one decimal place)arrow_forward
- Use the regression equation to predict the suicide rate for a state with a divorce rate of 6.5. Y = -0.20 + 2.87xarrow_forwardA regression was run to determine if there is a relationship between hours of TV watched per day, x, and number of sit-ups, y, a person can do in a minute. The results of the regression were: y=ax+b a=-0.901 b=21.855 Use this to predict the number of sit-ups a person who watches 10 hours of TV can do in a minute. Round to the nearest whole number.arrow_forwardWhat is the slope and intercept for the regression equation given this data?X = -5, 34, 56, 0, 61Y = 13, 63, 46, -23, 50arrow_forward
arrow_back_ios
SEE MORE QUESTIONS
arrow_forward_ios
Recommended textbooks for you
- MATLAB: An Introduction with ApplicationsStatisticsISBN:9781119256830Author:Amos GilatPublisher:John Wiley & Sons Inc
 Probability and Statistics for Engineering and th...StatisticsISBN:9781305251809Author:Jay L. DevorePublisher:Cengage Learning
 Statistics for The Behavioral Sciences (MindTap C...StatisticsISBN:9781305504912Author:Frederick J Gravetter, Larry B. WallnauPublisher:Cengage Learning
  Elementary Statistics: Picturing the World (7th E...StatisticsISBN:9780134683416Author:Ron Larson, Betsy FarberPublisher:PEARSON
 The Basic Practice of StatisticsStatisticsISBN:9781319042578Author:David S. Moore, William I. Notz, Michael A. FlignerPublisher:W. H. Freeman
 Introduction to the Practice of StatisticsStatisticsISBN:9781319013387Author:David S. Moore, George P. McCabe, Bruce A. CraigPublisher:W. H. Freeman
MATLAB: An Introduction with Applications
Statistics
ISBN:9781119256830
Author:Amos Gilat
Publisher:John Wiley & Sons Inc
Probability and Statistics for Engineering and th...
Statistics
ISBN:9781305251809
Author:Jay L. Devore
Publisher:Cengage Learning
Statistics for The Behavioral Sciences (MindTap C...
Statistics
ISBN:9781305504912
Author:Frederick J Gravetter, Larry B. Wallnau
Publisher:Cengage Learning
Elementary Statistics: Picturing the World (7th E...
Statistics
ISBN:9780134683416
Author:Ron Larson, Betsy Farber
Publisher:PEARSON
The Basic Practice of Statistics
Statistics
ISBN:9781319042578
Author:David S. Moore, William I. Notz, Michael A. Fligner
Publisher:W. H. Freeman
Introduction to the Practice of Statistics
Statistics
ISBN:9781319013387
Author:David S. Moore, George P. McCabe, Bruce A. Craig
Publisher:W. H. Freeman