MATLAB: An Introduction with Applications
6th Edition
ISBN: 9781119256830
Author: Amos Gilat
Publisher: John Wiley & Sons Inc
expand_more
expand_more
format_list_bulleted
Question
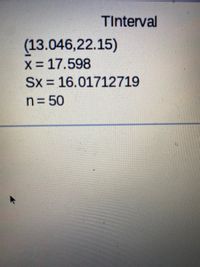
Refer to the data display from a sample of airport data speeds in Mbps. What is the number of degrees of freedom that should be used for finding the critical value ta/2 ?

Transcribed Image Text:TInterval
(13.046,22.15)
X 17.598
Sx = 16.01712719
n= 50
Expert Solution
This question has been solved!
Explore an expertly crafted, step-by-step solution for a thorough understanding of key concepts.
This is a popular solution
Trending nowThis is a popular solution!
Step by stepSolved in 2 steps

Knowledge Booster
Similar questions
- What is the relative frequency of deaths that occurred in 2000 or before?arrow_forwardPlease round it to 4 decimal places and add the excel formulas as well.arrow_forward10) The top point in the scatter plot (6.5, 1459) is for Washington, DC. Find the predicted DC violent crime rate if x=6.5. Then find the residual for DC using the predicted violence crime rate and the actual violent crime rate (the actual crime rate is provided in the first sentence of this question). Prediction = Actual y-value = Residual =arrow_forward
- The toco toucan, the largest member of the toucan family, possesses the largest beak relative to body size of all birds. This exaggerated feature has received various interpretations, such as being a refined adaptation for feeding. However, the large surface area may also be an important mechanism for radiating heat (and hence cooling the bird) as outdoor temperature increases. Presented is the data for beak heat loss, as a percent of total body heat loss from all sources, at various temperatures in degrees Celsius. [Note: The numerical values in this problem have been modified for testing purposes.] Temperature (°C) 1515 1616 1717 1818 1919 2020 2121 2222 2323 2424 2525 2626 2727 2828 2929 3030 Percent heat loss from beak 3232 3636 3636 3333 3535 4747 5757 5151 4242 5353 4646 5252 5959 5959 6363 6262 (a) What is the equation of the least‑squares regression line for predicting beak heat loss, as a percent of total body heat loss from all sources, from temperature? (Use…arrow_forwardSuppose that you wish to estimate the difference between mean pH measurements of rainfalls in two different locations, one in relatively unpolluted area and the other in an area subject to heavy air pollution. You want to be 95% confident that the margin of error for the difference between mean pH of rainfalls in relatively unpolluted area and mean pH of rainfalls in an area subject to heavy air pollution will not exceed 0.1 pH. How many rainfalls (pH measurements) must be included in each sample? Assume that the variance of pH measurements in a relatively unpolluted area is equal to 2 = 20, and the variance of pH measurements in an area subject to heavy pollution is equal to 2 = 0.25, and samples will be of equal size (n = n₂ = n). 2 It is supposed that values of pH in rainfalls are normally distributed in polluted and unpolluted areas. The number of rainfalls (pH measurements) that must be included in each sample isarrow_forwardPlease anwser using SPSS!arrow_forward
- In a data set with 25 scores, if the value 16 occurs 12 times, what is its relative frequency?arrow_forwardA study was conducted at a local college to analyze the average cumulative GPA of students who graduated last year. Which of these terms is used to refer to: the average cumulative GPA of students in the study who graduated from the college last year?arrow_forwardPlease show work in Excel.arrow_forward
arrow_back_ios
arrow_forward_ios
Recommended textbooks for you
 MATLAB: An Introduction with ApplicationsStatisticsISBN:9781119256830Author:Amos GilatPublisher:John Wiley & Sons Inc
 Probability and Statistics for Engineering and th...StatisticsISBN:9781305251809Author:Jay L. DevorePublisher:Cengage Learning
 Statistics for The Behavioral Sciences (MindTap C...StatisticsISBN:9781305504912Author:Frederick J Gravetter, Larry B. WallnauPublisher:Cengage Learning
 Elementary Statistics: Picturing the World (7th E...StatisticsISBN:9780134683416Author:Ron Larson, Betsy FarberPublisher:PEARSON
 The Basic Practice of StatisticsStatisticsISBN:9781319042578Author:David S. Moore, William I. Notz, Michael A. FlignerPublisher:W. H. Freeman
 Introduction to the Practice of StatisticsStatisticsISBN:9781319013387Author:David S. Moore, George P. McCabe, Bruce A. CraigPublisher:W. H. Freeman

MATLAB: An Introduction with Applications
Statistics
ISBN:9781119256830
Author:Amos Gilat
Publisher:John Wiley & Sons Inc

Probability and Statistics for Engineering and th...
Statistics
ISBN:9781305251809
Author:Jay L. Devore
Publisher:Cengage Learning

Statistics for The Behavioral Sciences (MindTap C...
Statistics
ISBN:9781305504912
Author:Frederick J Gravetter, Larry B. Wallnau
Publisher:Cengage Learning

Elementary Statistics: Picturing the World (7th E...
Statistics
ISBN:9780134683416
Author:Ron Larson, Betsy Farber
Publisher:PEARSON

The Basic Practice of Statistics
Statistics
ISBN:9781319042578
Author:David S. Moore, William I. Notz, Michael A. Fligner
Publisher:W. H. Freeman

Introduction to the Practice of Statistics
Statistics
ISBN:9781319013387
Author:David S. Moore, George P. McCabe, Bruce A. Craig
Publisher:W. H. Freeman