
MATLAB: An Introduction with Applications
6th Edition
ISBN: 9781119256830
Author: Amos Gilat
Publisher: John Wiley & Sons Inc
expand_more
expand_more
format_list_bulleted
Related questions
Question

Transcribed Image Text:M Question 6 of 20 - Chapter 1 Homework
Reader
O Resources
x Give Up?
O Hint
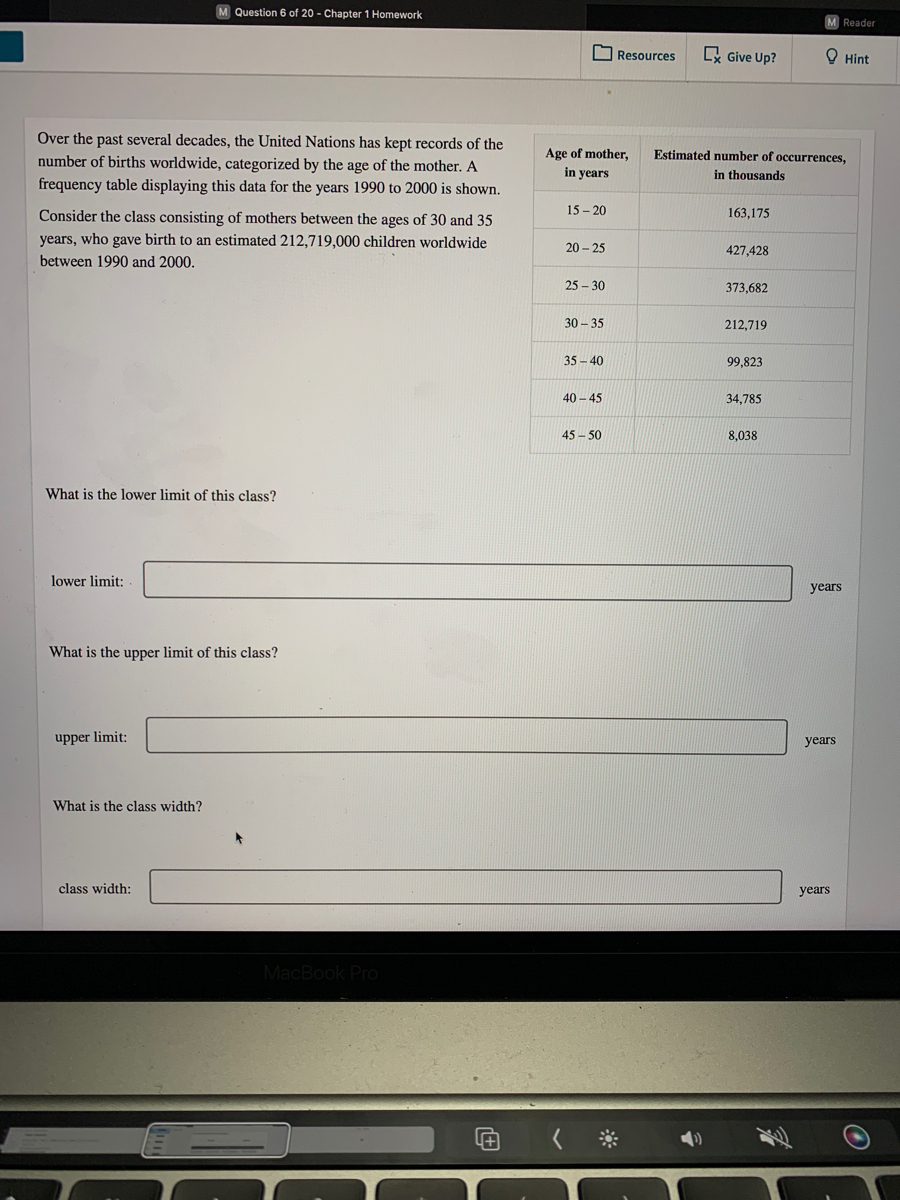
Over the past several decades, the United Nations has kept records of the
Age of mother,
Estimated number of occurrences,
number of births worldwide, categorized by the age of the mother. A
frequency table displaying this data for the years 1990 to 2000 is shown.
in years
in thousands
Consider the class consisting of mothers between the ages of 30 and 35
15 - 20
163,175
years, who gave birth to an estimated 212,719,000 children worldwide
20 - 25
427,428
between 1990 and 2000.
25 – 30
373,682
30 - 35
212,719
35 - 40
99,823
40 - 45
34,785
45 - 50
8,038
What is the lower limit of this class?
lower limit:
years
What is the upper limit of this class?
upper limit:
years
What is the class width?
class width:
years
MacBook Pro
Expert Solution
This question has been solved!
Explore an expertly crafted, step-by-step solution for a thorough understanding of key concepts.

This is a popular solution

Trending nowThis is a popular solution!

Step by stepSolved in 2 steps

Follow-up Questions
Read through expert solutions to related follow-up questions below.
Follow-up Question
What is the midpoint of this class? Round your answer to one decimal place.
Solution
by Bartleby Expert
Follow-up Questions
Read through expert solutions to related follow-up questions below.
Follow-up Question
What is the midpoint of this class? Round your answer to one decimal place.
Solution
by Bartleby Expert
Knowledge Booster

Similar questions
- Over the past several decades, the United Nations has kept records of the number of births worldwide, categorized by the age of the mother. A frequency table displaying this data for the years 1960 to 1970 is shown. Consider the class consisting of mothers between the ages of 40 and 45 years, who gave birth to an estimated 52,335,000 children worldwide between 1960 and 1970. Age of mother,in years Estimated number of occurrences,in thousands 15 – 20 125,075 20 – 25 312,055 25 – 30 300,458 30 – 35 217,581 35 – 40 131,236 40 – 45 52,335 45 – 50 10,577 Over the past several decades, the United Nations has kept records of the number of births worldwide, categorized by the age of the mother. A frequency table displaying this data for the years 1960 to 1970 is shown. Consider the class consisting of mothers between the ages of 40 and 45 years, who gave birth to an estimated 52,335,000 children worldwide between 1960 and 1970. What is the lower limit of this class?…arrow_forwardAccording to dmbalmanac.com, the breakdown of albums from which Dave Matthews sang at his 'Solo at Home' tour during the Coronavirus are depicted in the frequency distribution below. What percent of his songs were from 'Big Whiskey and the GrooGrux King'? Dave Matthews songs Albums Unreleased 20.5% Dave Matthews - Some Devil 14.3% Busted Stuff 8.0% Cover Songs 8.0% Away from the World 8.0% Under the Table and Dreaming 7.1% Come Tomorrow 7.1% Crash 6.3% Before These Crowded Streets 6.3% Remember Two Things 3.6% Stand Up 3.6% Miscellaneous Release 2.7% Everyday 1.8% Big Whiskey and the GrooGrux King Live Collaboration 0.9%arrow_forwardData was collected for 225 fish from the North Atlantic. The length of the fish (in cm) is summarized in the histogram below. 40 35 30 25 20 15 10 15 30 45 60 75 90 105 120 length of fish (cm) Based on the Histogram above, reconstruct the corresponding Frequency Distribution Table Class Frequency Áuənbəsarrow_forward
- 1. What information should be present in a frequency table and why?arrow_forwardAmong fatal plane crashes that occurred during the past 50 years, 668 were due to pilot error, 57 were due to other human error, 628 were due to weather, 449 were due to mechanical problems, and 325 were due to sabotage. Construct the relative frequency distribution. What is the most serious threat to aviation safety, and can anything be done about it? Cause Frequency Pilot error Other human error Weather Mechanical problems Sabotage % (Round to one decimal place as needed.) % %arrow_forwardThe following data represents the age of 30 lottery winners. 24 25 26 26 34 35 37 37 40 41 43 43 45 48 50 51 54 56 57 62 63 65 65 68 70 75 76 79 79 83 Complete the frequency distribution for the data. Age Frequency 20-29 30-39 40-49 50-59 60-69 70-79 80-89arrow_forward
arrow_back_ios
arrow_forward_ios
Recommended textbooks for you
- MATLAB: An Introduction with ApplicationsStatisticsISBN:9781119256830Author:Amos GilatPublisher:John Wiley & Sons Inc
 Probability and Statistics for Engineering and th...StatisticsISBN:9781305251809Author:Jay L. DevorePublisher:Cengage Learning
 Statistics for The Behavioral Sciences (MindTap C...StatisticsISBN:9781305504912Author:Frederick J Gravetter, Larry B. WallnauPublisher:Cengage Learning
  Elementary Statistics: Picturing the World (7th E...StatisticsISBN:9780134683416Author:Ron Larson, Betsy FarberPublisher:PEARSON
 The Basic Practice of StatisticsStatisticsISBN:9781319042578Author:David S. Moore, William I. Notz, Michael A. FlignerPublisher:W. H. Freeman
 Introduction to the Practice of StatisticsStatisticsISBN:9781319013387Author:David S. Moore, George P. McCabe, Bruce A. CraigPublisher:W. H. Freeman
MATLAB: An Introduction with Applications
Statistics
ISBN:9781119256830
Author:Amos Gilat
Publisher:John Wiley & Sons Inc
Probability and Statistics for Engineering and th...
Statistics
ISBN:9781305251809
Author:Jay L. Devore
Publisher:Cengage Learning
Statistics for The Behavioral Sciences (MindTap C...
Statistics
ISBN:9781305504912
Author:Frederick J Gravetter, Larry B. Wallnau
Publisher:Cengage Learning
Elementary Statistics: Picturing the World (7th E...
Statistics
ISBN:9780134683416
Author:Ron Larson, Betsy Farber
Publisher:PEARSON
The Basic Practice of Statistics
Statistics
ISBN:9781319042578
Author:David S. Moore, William I. Notz, Michael A. Fligner
Publisher:W. H. Freeman
Introduction to the Practice of Statistics
Statistics
ISBN:9781319013387
Author:David S. Moore, George P. McCabe, Bruce A. Craig
Publisher:W. H. Freeman