
Elementary Geometry For College Students, 7e
7th Edition
ISBN: 9781337614085
Author: Alexander, Daniel C.; Koeberlein, Geralyn M.
Publisher: Cengage,
expand_more
expand_more
format_list_bulleted
Related questions
Question
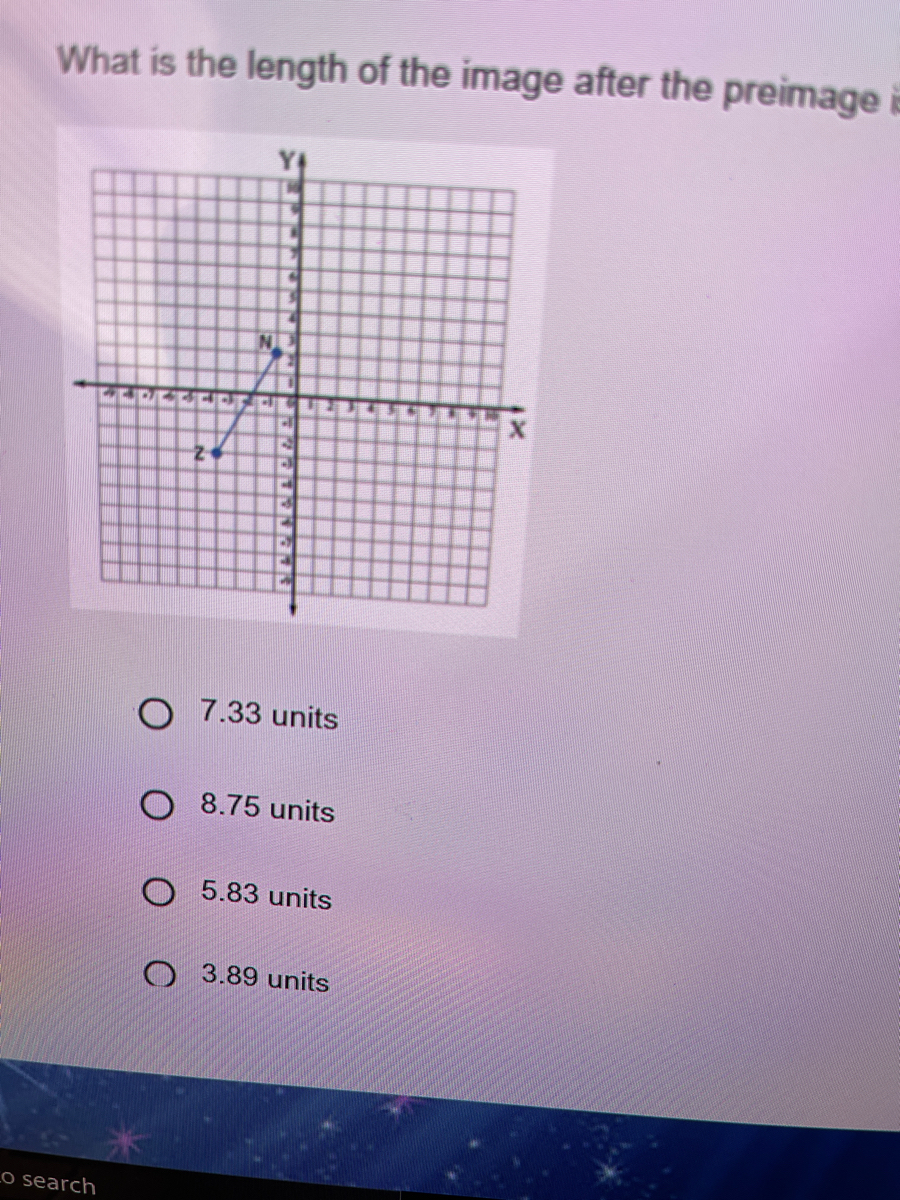

Transcribed Image Text:What is the length of the image after the preimage i
N.
O 7.33 units
O 8.75 units
O 5.83 units
O 3.89 units
Lo search

Transcribed Image Text:What is the length of the image after the preimage is dilated bya scale factor of 1.5? Note: Point Z is at (-4, -3) and point N is at (-1, 2)
O 7.33 units
O 8.75 units
O 5.83 units
O 3.89 units
Type here to search
F1
FS
F6
F7
F8
F9
F10
F11
F12
Prt Sc
Insert
@
#3
%
&
*
2
3
4
5
6
8
9
Ba
W
E
R
Y
|
P
J
K
V
B
Alt
Alt
Ctrl
Expert Solution
This question has been solved!
Explore an expertly crafted, step-by-step solution for a thorough understanding of key concepts.

This is a popular solution

Trending nowThis is a popular solution!

Step by stepSolved in 2 steps

Knowledge Booster

Similar questions
- help with 4! please i don’t understand..arrow_forwardThe histogram to the right represents the weights (in pounds) of members of a certain high-school math team. What is the class width? What are the approximate lower and upper class limits of the first class? ... What is the class width? The class width is (Simplify your answer.) What are the approximate lower and upper class limits of the first class? The approximate lower class limit is The approximate upper class limit is (Simplify your answers.) Frequency IL 0- 105 125 145 165 185 205 225 245 Weight (lbs) Q Garrow_forwardWhat is the length of the image after the preimage is dilated by a scale factor of ? O 5.83 units 23.32 units O 12.16 units 11.66 units 12arrow_forward
- Mein commute time in Atlanta, in minutes, using the data in CommuteAtlanta with n = 500, x bar= 29.11, and s = 20.72 1) positive t score? 2) SE? 3) Margin of error?arrow_forwardRel ACTIVITY 2 Published Edit ⠀ The heights of 50 students, measured to the nearest centimeters, have been found to be as follows: 0o 161, 150, 154, 165, 168, 161, 154, 162, 150, 151, 162, 164, 171, 165, 158, 154, 156, 172, 160, 170, 153, 159, 161, 170, 162, 165, 166, 168, 165, 164, 154, 152, 153, 156, 158, 162, 160, 161, 173, 166, 161, 159, 162, 167, 168, 159, 158, 153, 154, 159 1. Create a frequency distribution table using the format shown below: Interval Tally Frequency Relative Frequency Cummulative Frequency 2. Draw a Histogram and Frequency Polygon using the frequency distribution table constructed in number 1. **Note: the activity must be handwritten. >>arrow_forwardNeed help with #30arrow_forward
- Please explain and answerarrow_forwardMean Temperature (°C) The following scatterplot shows the mean annual carbon dioxide (CO,) in parts per million (ppm) d) What is the meaning of the slope of this equation? measured at the top of a mountain and the mean annual air temperature over both land and sea across the globe, in degrees Celsius (C). Complete parts a through h on the right. O A. For every degree that the mean temperature increases, CO, levels increase by 0.004 ppm. 16.800 O B. For every 0.004 ppm increase in CO, levels, the mean temperature increases by 1°C. 16.725 OC. For every 1 ppm increase in CO, levels, the mean temperature increases by 0.004°C. 16.650 O D. The slope does not have a meaningful interpretation in the context of this problem. 16.575 16.500 e) What is the meaning of the y-intercept of this equation? 337.5 CO, (ppm) 350.03 325.0 362.5 A. For every 1 ppm increase in CO, levels, the mean temperature increases by 0.004°C. Click here to view the regression output. O B. When the CO, level is 0 ppm, the…arrow_forwarddomain and rangearrow_forward
arrow_back_ios
arrow_forward_ios
Recommended textbooks for you
- Elementary Geometry For College Students, 7eGeometryISBN:9781337614085Author:Alexander, Daniel C.; Koeberlein, Geralyn M.Publisher:Cengage,
 Elementary Geometry for College StudentsGeometryISBN:9781285195698Author:Daniel C. Alexander, Geralyn M. KoeberleinPublisher:Cengage Learning
Elementary Geometry For College Students, 7e
Geometry
ISBN:9781337614085
Author:Alexander, Daniel C.; Koeberlein, Geralyn M.
Publisher:Cengage,
Elementary Geometry for College Students
Geometry
ISBN:9781285195698
Author:Daniel C. Alexander, Geralyn M. Koeberlein
Publisher:Cengage Learning