
MATLAB: An Introduction with Applications
6th Edition
ISBN: 9781119256830
Author: Amos Gilat
Publisher: John Wiley & Sons Inc
expand_more
expand_more
format_list_bulleted
Related questions
Question

Transcribed Image Text:- bbhosted.cuny.edu/webapps/assessment/take/launch.jsp?course_assessment_id%3_2002404 1&course_id3 2050858 12
Aplicaciones M Gmail YouTube
AMaps
Noticias
Traducir
* Question Completion Status:
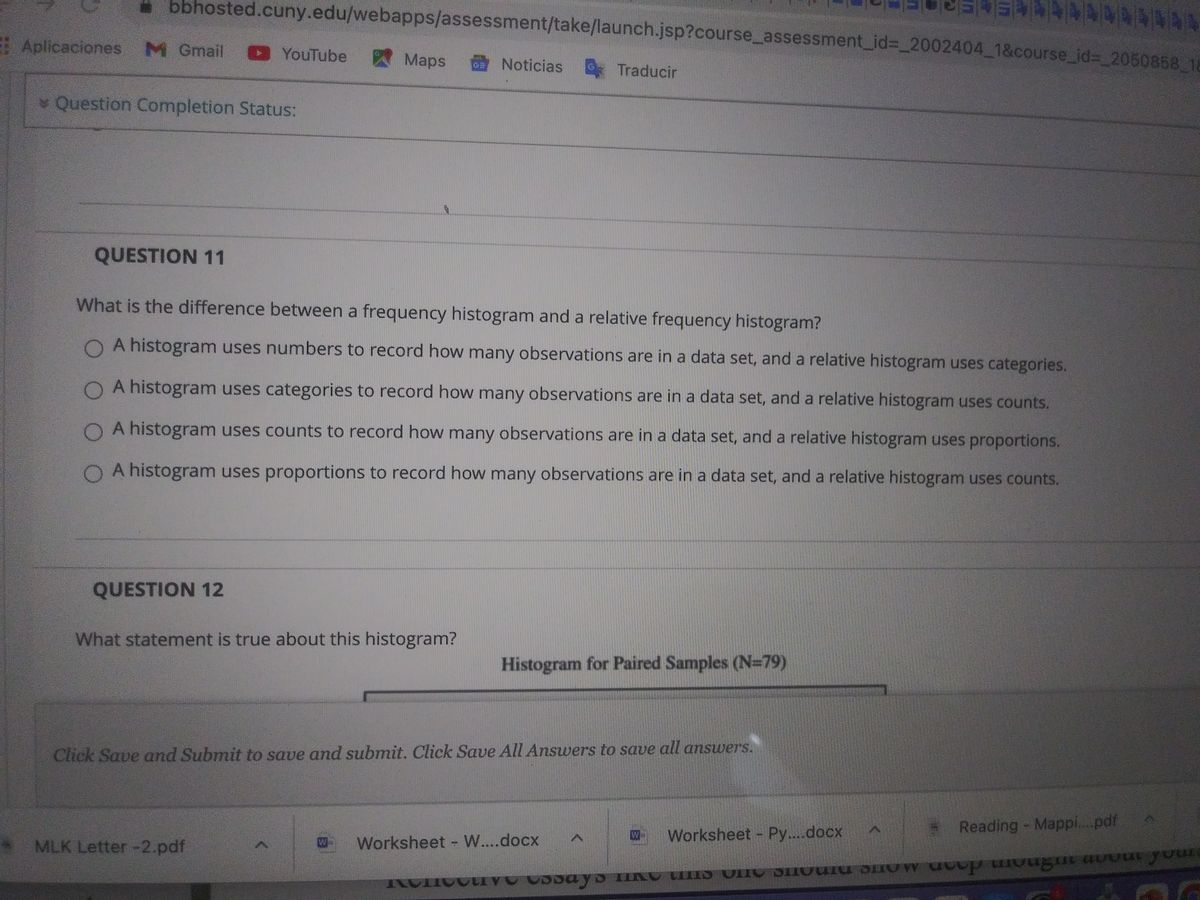
QUESTION 11
What is the difference between a frequency histogram and a relative frequency histogram?
O A histogram uses numbers to record how many observations are in a data set, and a relative histogram uses categories.
O A histogram uses categories to record how many observations are in a data set, and a relative histogram uses counts.
O A histogram uses counts to record how many observations are in a data set, and a relative histogram uses proportions.
O A histogram uses proportions to record how many observations are in a data set, and a relative histogram uses counts.
QUESTION 12
What statement is true about this histogram?
Histogram for Paired Samples (N=79)
Click Save and Submit to save and submit. Click Save All Answers to save all answers.
Worksheet Py....docx
Reading - Mappi..pdf
* MLK Letter -2.pdf
Worksheet - W....docx
Expert Solution
This question has been solved!
Explore an expertly crafted, step-by-step solution for a thorough understanding of key concepts.

This is a popular solution

Trending nowThis is a popular solution!

Step by stepSolved in 2 steps

Knowledge Booster

Similar questions
- What type of data (categorical, discrete numerical, continuous numerical) is each of the following variables? If there is any ambiguity about the data type, explain why the answer is unclear. Your college program. The number of college credits you have earned. Length of a TV commercial. The country with the most 2021 Olympic medalsarrow_forwardThe relative frequency of a class if 8 of the 40 data values lie within it is which of the following? The relative frequency of a class if 8 of the 40 data values lie within it is which of the following? 0.10 0.20 0.25 0.40arrow_forwardA student was interested in the cigarette-smoking habits of college students and collected data from an unbiased random sample of students. The data are summarized in the following table. Males who smoke Males who do not smoke Females who smoke Females who do not smoke What type of chart best represents the relative class frequencies? Multiple Choice Pie chart Box plot Frequency polygon 10 40 15 60 Scatterplotarrow_forward
- Can you do a histogram for Class 0-0.19, 0.20-0.39, 0.40-0.59, 0.60-0.79,0.80-0.99, 1.00-1.19, 1.20-1.39, Frequencies 25, 13, 5, 2, 2, 2, 3.arrow_forwardUse the following data set: 13, 8, 10, 7, 13, 9, 7, 11, 12, 10, 13 to answer questions The data is said to be Select one: a. bimodal b. multimodal c. Unimodalarrow_forwardIf a data set has an even number of observations, the medianarrow_forward
- A Hospital record for a patient indicates the patient's assigned department, room location and number of days the patient was treated. Classify each variable as qualitative or quantitative. A sample data table is listed below. Department Room Location Days of Treatment Maternity A102 2 Cardiac G210 5 Orthopedic C309 3arrow_forwardA car dealership records the number of cars sold each day over a week: 20, 25, 18, 22, 26, 19, and 21. Calculate the mean, median, and mode of the number of cars sold per day.arrow_forwardThe following questions refer to this data set: 39 72 84 34 20 87 26 59 85 85 What is the mean of this data set? mean = (Round your answer to one decimal place if necessary.) What is the median of this data set? median = What is the mode of this data set? mode =arrow_forward
- For the given data set, find the a. mean b. median c. mode (or state that there is no mode) d. midrange. Ages of teachers in the mathematics department of a certain high school: 26, 51, 39, 60, 26, 51, 26, 50, 50, 41arrow_forwardA statistic is a measure that describes a population characteristic.arrow_forward
arrow_back_ios
arrow_forward_ios
Recommended textbooks for you
- MATLAB: An Introduction with ApplicationsStatisticsISBN:9781119256830Author:Amos GilatPublisher:John Wiley & Sons Inc
 Probability and Statistics for Engineering and th...StatisticsISBN:9781305251809Author:Jay L. DevorePublisher:Cengage Learning
 Statistics for The Behavioral Sciences (MindTap C...StatisticsISBN:9781305504912Author:Frederick J Gravetter, Larry B. WallnauPublisher:Cengage Learning
  Elementary Statistics: Picturing the World (7th E...StatisticsISBN:9780134683416Author:Ron Larson, Betsy FarberPublisher:PEARSON
 The Basic Practice of StatisticsStatisticsISBN:9781319042578Author:David S. Moore, William I. Notz, Michael A. FlignerPublisher:W. H. Freeman
 Introduction to the Practice of StatisticsStatisticsISBN:9781319013387Author:David S. Moore, George P. McCabe, Bruce A. CraigPublisher:W. H. Freeman
MATLAB: An Introduction with Applications
Statistics
ISBN:9781119256830
Author:Amos Gilat
Publisher:John Wiley & Sons Inc
Probability and Statistics for Engineering and th...
Statistics
ISBN:9781305251809
Author:Jay L. Devore
Publisher:Cengage Learning
Statistics for The Behavioral Sciences (MindTap C...
Statistics
ISBN:9781305504912
Author:Frederick J Gravetter, Larry B. Wallnau
Publisher:Cengage Learning
Elementary Statistics: Picturing the World (7th E...
Statistics
ISBN:9780134683416
Author:Ron Larson, Betsy Farber
Publisher:PEARSON
The Basic Practice of Statistics
Statistics
ISBN:9781319042578
Author:David S. Moore, William I. Notz, Michael A. Fligner
Publisher:W. H. Freeman
Introduction to the Practice of Statistics
Statistics
ISBN:9781319013387
Author:David S. Moore, George P. McCabe, Bruce A. Craig
Publisher:W. H. Freeman