
MATLAB: An Introduction with Applications
6th Edition
ISBN: 9781119256830
Author: Amos Gilat
Publisher: John Wiley & Sons Inc
expand_more
expand_more
format_list_bulleted
Related questions
Concept explainers
Question
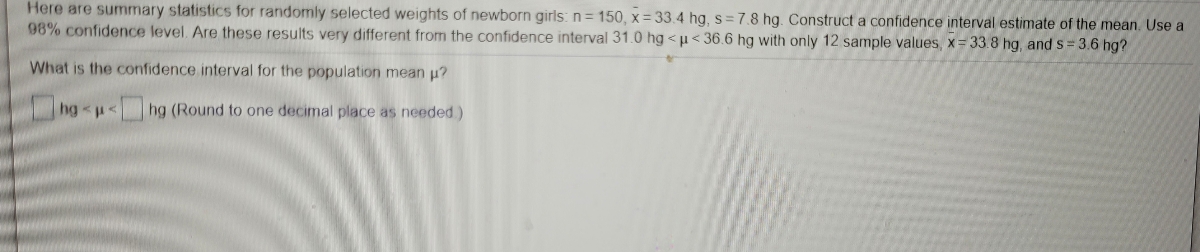

Transcribed Image Text:Here are summary statistics for randomly selected weights of newborn girls: n= 150, x = 33.4 hg, s = 7.8 hg. Construct a confidence interval estimate of the mean. Use a
98% confidence level. Are these results very different from the confidence interval 31.0 hg <µ< 36.6 hg with only 12 sample values, x= 33.8 hg, and s= 3.6 hg?
What is the confidence interval for the population mean u?
hg
hg (Round to one decimal place as needed)
Expert Solution
This question has been solved!
Explore an expertly crafted, step-by-step solution for a thorough understanding of key concepts.

Step by stepSolved in 2 steps

Knowledge Booster


Learn more about
Need a deep-dive on the concept behind this application? Look no further. Learn more about this topic, statistics and related others by exploring similar questions and additional content below.Similar questions
- Construct a confidence interval for p, - p, at the given level of confidence. X1 = 398, n1 = 543, x2 = 408, n2 = 578, 99% confidence The researchers are % confident the difference between the two population proportions, p, - p2, is between and (Use ascending order. Type an integer or decimal rounded to three decimal places as needed.)arrow_forwardWhich of these is NOT a way to express a confidence interval for the mean? (59.41, 81.72) 46.78 < x̄ < 62.90 42 ± 3.2 45.2 < μ < 63.7arrow_forwardA researcher wants to estimate the mean blood cholesterol level of young men ages 15-25 with a 90.16% confidence interval. The blood cholesterol level of young men follows a Normal distribution with standard deviation σ = 15 mg/dl. How large a sample would the researcher need to take to estimate the mean blood cholesterol to within 7 mg/dl? A sample of at least______peoplearrow_forward
- Construct a confidence interval for p, - P, at the given level of confidence. X1 = 34, n1 = 273, x2 = 32, n2 = 313, 90% confidence The researchers are % confident the difference between the two population proportions, p, - P2, is between and (Use ascending order. Type an integer or decimal rounded to three decimal places as needed.)arrow_forwardHelp!arrow_forwardConstruct a confidence interval for P₁-P₂ at the given level of confidence. X₁ = 369, n₁ = 508, X₂ = 426, n₂ = 599, 95% confidence % The researchers are confident the difference between the two population proportions, P₁-P₂, is between and (Use ascending order. Type an integer or decimal rounded to three decimal places as needed.)arrow_forward
- Construct a confidence interval for p1- P2 at the given level of confidence. x1 = 26, n1 = 270, x2 = 38, n2 = 296, 99% confidence The researchers are 1% confident the difference between the two population proportions, p1 - P2, is between and (Use ascending order. Type an integer or decimal rounded to three decimal places as needed.)arrow_forwardConstruct a confidence interval for P₁ P2 at the given level of confidence. x₁ = 391, n₁ =529, x₂ = 421, n₂ = 577, 90% confidence The researchers are % confident the difference between the two population proportions, p₁ - P2, is between and (Use ascending order. Type an integer or decimal rounded to three decimal places as needed.)arrow_forward
arrow_back_ios
arrow_forward_ios
Recommended textbooks for you
- MATLAB: An Introduction with ApplicationsStatisticsISBN:9781119256830Author:Amos GilatPublisher:John Wiley & Sons Inc
 Probability and Statistics for Engineering and th...StatisticsISBN:9781305251809Author:Jay L. DevorePublisher:Cengage Learning
 Statistics for The Behavioral Sciences (MindTap C...StatisticsISBN:9781305504912Author:Frederick J Gravetter, Larry B. WallnauPublisher:Cengage Learning
  Elementary Statistics: Picturing the World (7th E...StatisticsISBN:9780134683416Author:Ron Larson, Betsy FarberPublisher:PEARSON
 The Basic Practice of StatisticsStatisticsISBN:9781319042578Author:David S. Moore, William I. Notz, Michael A. FlignerPublisher:W. H. Freeman
 Introduction to the Practice of StatisticsStatisticsISBN:9781319013387Author:David S. Moore, George P. McCabe, Bruce A. CraigPublisher:W. H. Freeman
MATLAB: An Introduction with Applications
Statistics
ISBN:9781119256830
Author:Amos Gilat
Publisher:John Wiley & Sons Inc
Probability and Statistics for Engineering and th...
Statistics
ISBN:9781305251809
Author:Jay L. Devore
Publisher:Cengage Learning
Statistics for The Behavioral Sciences (MindTap C...
Statistics
ISBN:9781305504912
Author:Frederick J Gravetter, Larry B. Wallnau
Publisher:Cengage Learning
Elementary Statistics: Picturing the World (7th E...
Statistics
ISBN:9780134683416
Author:Ron Larson, Betsy Farber
Publisher:PEARSON
The Basic Practice of Statistics
Statistics
ISBN:9781319042578
Author:David S. Moore, William I. Notz, Michael A. Fligner
Publisher:W. H. Freeman
Introduction to the Practice of Statistics
Statistics
ISBN:9781319013387
Author:David S. Moore, George P. McCabe, Bruce A. Craig
Publisher:W. H. Freeman