
MATLAB: An Introduction with Applications
6th Edition
ISBN: 9781119256830
Author: Amos Gilat
Publisher: John Wiley & Sons Inc
expand_more
expand_more
format_list_bulleted
Related questions
Question
2w.need help with parts a-c
a.What is the chi-squared test statistic for this data set?What is the appropriate degrees of freedom value for this test?
b.What is the critical value that you would use to determine if there is a difference in the distributions of fish sizes across the different lakes?
c.Select a conclusion statement from a list of choices.(photo attached)
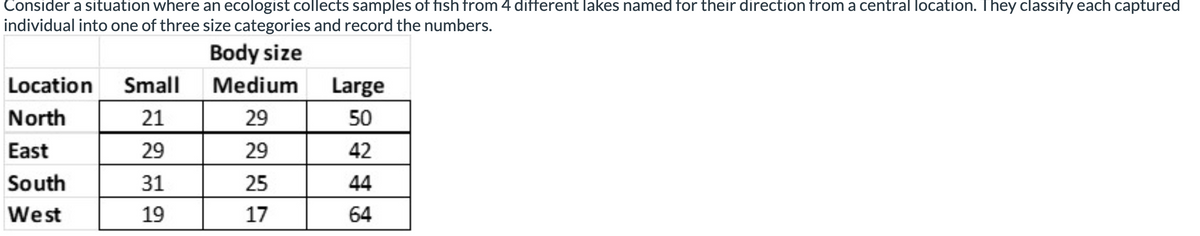

Transcribed Image Text:Consider a situation where an ecologist collects samples of fish from 4 different lakes named for their direction from a central location. They classify each captured
individual into one of three size categories and record the numbers.
Body size
Medium
29
29
25
17
Location Small
North
21
East
29
South
31
West
19
Large
50
42
44
64

Transcribed Image Text:There is good evidence that the distributions of sizes of fish appear to be different in the different lakes (p>0.05).
There is good evidence that the distributions of sizes of fish appear to be different in the different lakes (0.025<p<0.05).
There is good evidence that the distributions of sizes of fish appear to be different in the different lakes (0.02<p<0.025).
There is good evidence that the distributions of sizes of fish appear to be different in the different lakes (0.01<p<0.02).
There is good evidence that the distributions of sizes of fish appear to be different in the different lakes (0.001<p<0.01).
There is good evidence that the distributions of sizes of fish appear to be different in the different lakes (p<0.001).
There is not good evidence that the distributions of sizes of fish appear to be different in the different lakes (p>0.
There is not good evidence that the distributions of sizes of fish appear to be different in the different lakes(0.025<p<0.05).
There is not good evidence that the distributions of sizes of fish appear to be different in the different lakes(0.02<p<0.025).
There is not good evidence that the distributions of sizes of fish appear to be different in the different lakes(0.01<p<0.02).
There is not good evidence that the distributions of sizes of fish appear to be different in the different lakes (0.001<p<0.01).
There is not good evidence that the distributions of sizes of fish appear to be different in the different lakes(p<0.001).
Expert Solution
This question has been solved!
Explore an expertly crafted, step-by-step solution for a thorough understanding of key concepts.

Step by stepSolved in 6 steps with 3 images

Knowledge Booster

Similar questions
- In the US, 43.9% of all people have type O blood, 40.6% have type A blood, 10.8% have type B blood and 4.7% have type AB blood. A researcher wants to see if the distribution of blood type is different for millionaires. The table below shows the results of a random sample of 3488 millionaires. What can be concluded at the a = 0.05 significance level? a. Complete the table by filling in the expected frequencies. Round to the nearest whole number: Frequencies of Blood Type Outcome Frequency Expected Frequency 1521 A 1427 В 376 АВ 164arrow_forward3. You would like to determine if there is a statistical relationship between the amount of caffein in a cup of coffee and their sales at their coffee franchises. The data is included in the set "Coffee by the Cup". Here is information about the variables. Variable Caffeine Cups Sold Measurement Amount of caffeine in one cup Number of cups of the coffee Units Milligrams Cups sold sold at all of the franchises a. Which variable is the explanatory variable and which variable is the response variable? b. Construct a scatterplot of the data. Based upon the scatterplot is there a linear relationship between the amount of caffeine in one cup of the coffee and the number of cups of coffee sold? Justify your reasoning using the scatterplot. c. Run a t-test for correlation using technology. Make sure you include the p-value and the printout. According to the t-test, is there a statistical relationship between the amount of caffeine in a cup of coffee and the number of cups sold? Justify your…arrow_forwardThe variables in this dataset are as follows: Weight (weight of the respondent), Race (race of the respondent), HAPMAR (happiness with marriage), and AreaCode (area code). 1. What is the scale of measurement of these four different variables?arrow_forward
- I need help with parts c-earrow_forwardA certain statistics instructor participates in triathlons. The accompanying table lists times (in minutes and seconds) he recorded while riding a bicycle for five laps through each mile of a 3-mile loop. Use a 0.05 significance level to test the claim that it takes the same time to ride each of the miles. Does one of the miles appear to have a hill? LOADING... Click the icon to view the data table of the riding times. Question content area bottom Part 1 Determine the null and alternative hypotheses. H0: ▼ mu 1 greater than mu 2 greater than mu 3μ1>μ2>μ3 mu 1 not equals mu 2 not equals mu 3μ1≠μ2≠μ3 Exactly two of the population means are different from each other.Exactly two of the population means are different from each other. At least one of the three population means is different from the others.At least one of the three population means is different from the others. mu 1 equals mu 2 equals mu 3μ1=μ2=μ3 H1: ▼ mu 1 greater than mu 2…arrow_forwardProvided below is a simple data set for you to practice finding descriptive measures. For the data set, complete parts (a) through (c) below. 1,4,7,8 a. Obtain the quartiles. Q₂ Q₂ = (Type integers or decimals. Do not round.) b. Determine the interquartile range. The interquartile range is (Type an integer or a decimal. Do not round.) c. Find the five-number summary. 0.000.0 (Type integers or decimals. Do not round. Use ascending order.)arrow_forward
arrow_back_ios
arrow_forward_ios
Recommended textbooks for you
- MATLAB: An Introduction with ApplicationsStatisticsISBN:9781119256830Author:Amos GilatPublisher:John Wiley & Sons Inc
 Probability and Statistics for Engineering and th...StatisticsISBN:9781305251809Author:Jay L. DevorePublisher:Cengage Learning
 Statistics for The Behavioral Sciences (MindTap C...StatisticsISBN:9781305504912Author:Frederick J Gravetter, Larry B. WallnauPublisher:Cengage Learning
  Elementary Statistics: Picturing the World (7th E...StatisticsISBN:9780134683416Author:Ron Larson, Betsy FarberPublisher:PEARSON
 The Basic Practice of StatisticsStatisticsISBN:9781319042578Author:David S. Moore, William I. Notz, Michael A. FlignerPublisher:W. H. Freeman
 Introduction to the Practice of StatisticsStatisticsISBN:9781319013387Author:David S. Moore, George P. McCabe, Bruce A. CraigPublisher:W. H. Freeman
MATLAB: An Introduction with Applications
Statistics
ISBN:9781119256830
Author:Amos Gilat
Publisher:John Wiley & Sons Inc
Probability and Statistics for Engineering and th...
Statistics
ISBN:9781305251809
Author:Jay L. Devore
Publisher:Cengage Learning
Statistics for The Behavioral Sciences (MindTap C...
Statistics
ISBN:9781305504912
Author:Frederick J Gravetter, Larry B. Wallnau
Publisher:Cengage Learning
Elementary Statistics: Picturing the World (7th E...
Statistics
ISBN:9780134683416
Author:Ron Larson, Betsy Farber
Publisher:PEARSON
The Basic Practice of Statistics
Statistics
ISBN:9781319042578
Author:David S. Moore, William I. Notz, Michael A. Fligner
Publisher:W. H. Freeman
Introduction to the Practice of Statistics
Statistics
ISBN:9781319013387
Author:David S. Moore, George P. McCabe, Bruce A. Craig
Publisher:W. H. Freeman