
MATLAB: An Introduction with Applications
6th Edition
ISBN: 9781119256830
Author: Amos Gilat
Publisher: John Wiley & Sons Inc
expand_more
expand_more
format_list_bulleted
Related questions
Question
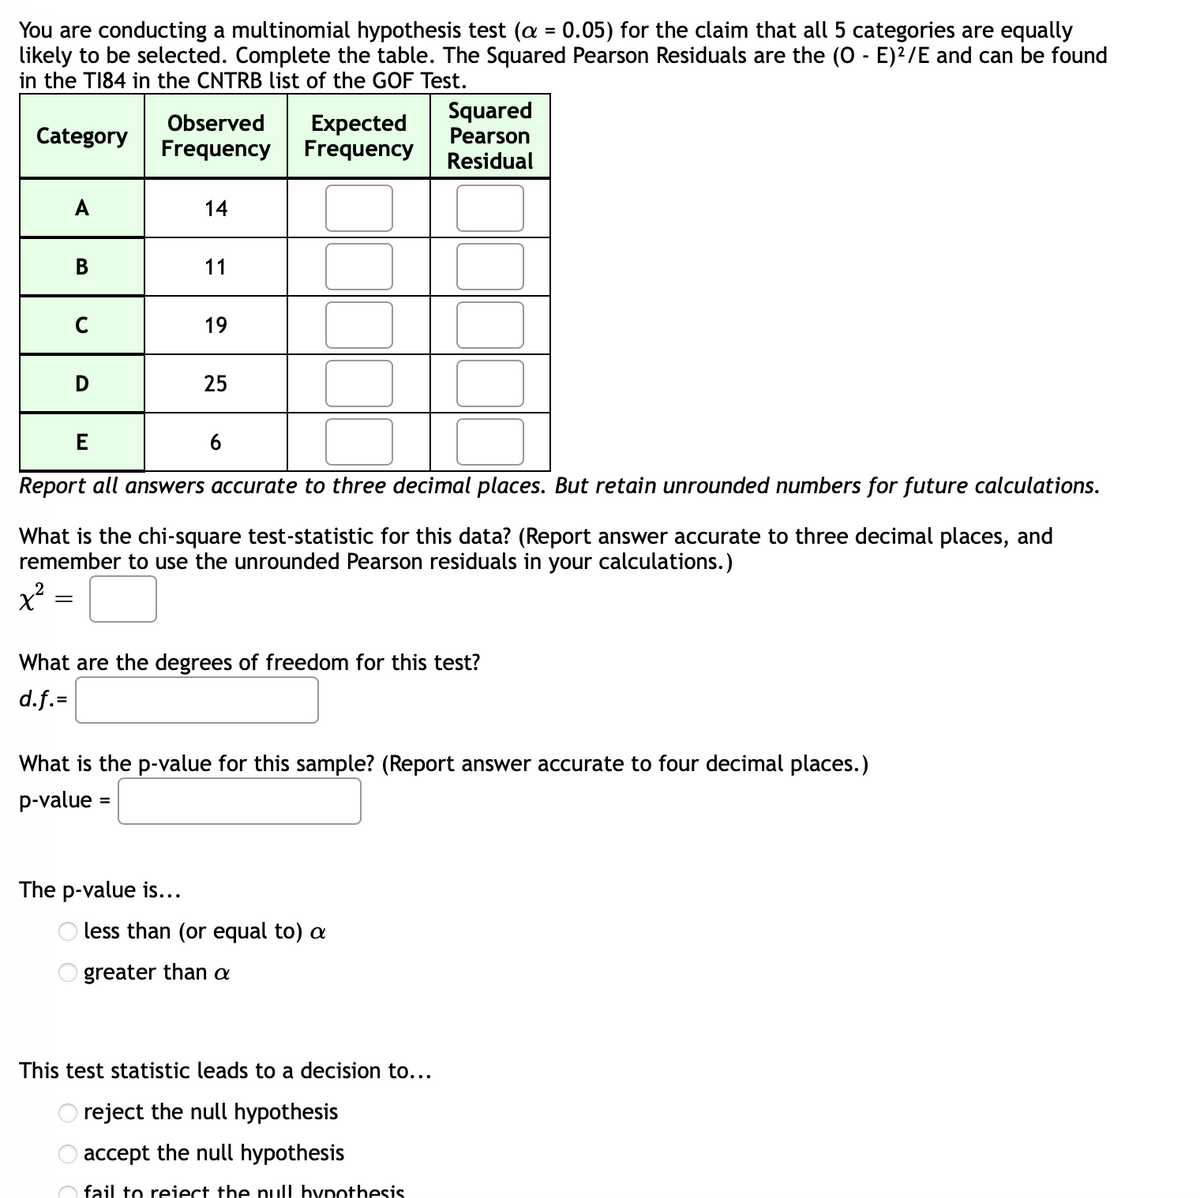

Transcribed Image Text:You are conducting a multinomial hypothesis test (a = 0.05) for the claim that all 5 categories are equally
likely to be selected. Complete the table. The Squared Pearson Residuals are the (0 - E)2/E and can be found
in the TI84 in the CNTRB list of the GOF Test.
Expected
Frequency
Squared
Pearson
Observed
Category
Frequency
Residual
A
14
В
11
C
19
D
25
E
Report all answers accurate to three decimal places. But retain unrounded numbers for future calculations.
What is the chi-square test-statistic for this data? (Report answer accurate to three decimal places, and
remember to use the unrounded Pearson residuals in your calculations.)
x²
What are the degrees of freedom for this test?
d.f.=
What is the p-value for this sample? (Report answer accurate to four decimal places.)
p-value =
The p-value is...
less than (or equal to) a
O greater than a
This test statistic leads to a decision to...
O reject the null hypothesis
accept the null hypothesis
fail to reiect the null hypothesis

Transcribed Image Text:What is the chi-square test-statistic for this data? (Report answer accurate to three decimal places, and
remember to use the unrounded Pearson residuals in your calculations.)
What are the degrees of freedom for this test?
d.f.=
What is the p-value for this sample? (Report answer accurate to four decimal places.)
p-value
%3D
The p-value is...
O less than (or equal to) a
O greater than a
This test statistic leads to a decision to...
reject the null hypothesis
accept the null hypothesis
fail to reject the null hypothesis
accept the alternative hypothesis
As such, the final conclusion is that...
There is enough evidence to show that all 5 categories are not equally likely to be selected.
There is not enough evidence to show that all 5 categories are not equally likely to be selected.
There is enough evidence to show that all 5 categories are equally likely to be selected.
O There is not enough evidence show that all 5 categories are equally likely to be selected.
O O O O
Expert Solution
This question has been solved!
Explore an expertly crafted, step-by-step solution for a thorough understanding of key concepts.

This is a popular solution

Trending nowThis is a popular solution!

Step by stepSolved in 2 steps with 3 images

Knowledge Booster


Learn more about
Need a deep-dive on the concept behind this application? Look no further. Learn more about this topic, statistics and related others by exploring similar questions and additional content below.Similar questions
- What is the proportion that lies between the z scores under the normal curve? A. 1.00 and -1.00 B. 1.96 and -1.96 C. 2.58 and -2.58 D. 0.00 and 1.00 E. 1.50 and 0.10 F. 2.00 and 0.80arrow_forwardThe output below is for a t-test for the hypothesis: Individuals living in bad neighborhoods commit more crime than those living in good neighborhoods. The data in the Group Statistics section provides you with the average number of crimes committed by individuals living in good and bad neighborhoods and the standard deviation of this same variable. The findings of significance are located in the Independent Samples Test section. Pay particular attention to the "t" column and the "Sig (2-tailed)"column. The "t" column is the t value that you would have calculated by hand (as we learned in class). The "Sig (2-tailed)"column provides you with the p value (the level of significance of this relationship). In this column, any value below .05 indicates that you would have rejected your null hypothesis. 1. Can someone tell me about the relationship of all these data? I'm trying to determine if my hypothesis, listed below, can be proven or disproven? 2. What is the independent variable and…arrow_forwardattached - see image - question was previously not completed. I just got the answer for range - there are multiple questions within the problem - thanksarrow_forward
- You are conducting a test of homogeneity for the claim that two different populations have the same proportions of the following two characteristics. Here is the sample data. Population Population # 1 Category # 2 A. 18 13 B. 62 53 What is the chi-square test-statistic for this data? Report all answers accurate to three decimal places.arrow_forwardSeearrow_forwardYou are conducting a test of homogeneity for the claim that two different populations have the same proportions of the following two characteristics. Here is the sample data. Category Population Population # 1 # 2 21 79 B. 37 48 What is the chi-square test-statistic for this data? Report all answers accurate to three decimal places.arrow_forward
- You want to obtain a sample to estimate a population mean. Based on previous evidence, you believe the population standard deviation is approximately o = 22.3. You would like to be 98% confident that your estimate is within 3 of the true population mean. How large of a sample size is required? Do not round mid-calculation. n =arrow_forwardListed below are time intervals (min) between eruptions of a geyser. The "recent" times are within the past few years, and the "past" times are from 1995. Does it appear that the variation of the times between eruptions has changed? Use a 0.05 significance level. Assume that the two populations are normally distributed. E Click the icon to view the sample data. - X Sample data Identify the test statistic. The test statistic is (Round to two decimal places as needed.) Identify the P-value Recent 79 95 89 75 55 97 66 90 66 86 81 87 Past 92 85 94 99 68 82 89 98 84 98 92 91 The P-value is (Round to three decimal places as needed.) Print Done What is the conclusion for this hypothesis test? O A. Reject Ho. There is sufficient evidence to support the claim that the variation of the times between eruptions has changed. O B. Reject Ho. There is insufficient evidence to support the claim that the variation of the times between eruptions has changed. OC. Fail to reject Hg. There is sufficient…arrow_forward
arrow_back_ios
arrow_forward_ios
Recommended textbooks for you
- MATLAB: An Introduction with ApplicationsStatisticsISBN:9781119256830Author:Amos GilatPublisher:John Wiley & Sons Inc
 Probability and Statistics for Engineering and th...StatisticsISBN:9781305251809Author:Jay L. DevorePublisher:Cengage Learning
 Statistics for The Behavioral Sciences (MindTap C...StatisticsISBN:9781305504912Author:Frederick J Gravetter, Larry B. WallnauPublisher:Cengage Learning
  Elementary Statistics: Picturing the World (7th E...StatisticsISBN:9780134683416Author:Ron Larson, Betsy FarberPublisher:PEARSON
 The Basic Practice of StatisticsStatisticsISBN:9781319042578Author:David S. Moore, William I. Notz, Michael A. FlignerPublisher:W. H. Freeman
 Introduction to the Practice of StatisticsStatisticsISBN:9781319013387Author:David S. Moore, George P. McCabe, Bruce A. CraigPublisher:W. H. Freeman
MATLAB: An Introduction with Applications
Statistics
ISBN:9781119256830
Author:Amos Gilat
Publisher:John Wiley & Sons Inc
Probability and Statistics for Engineering and th...
Statistics
ISBN:9781305251809
Author:Jay L. Devore
Publisher:Cengage Learning
Statistics for The Behavioral Sciences (MindTap C...
Statistics
ISBN:9781305504912
Author:Frederick J Gravetter, Larry B. Wallnau
Publisher:Cengage Learning
Elementary Statistics: Picturing the World (7th E...
Statistics
ISBN:9780134683416
Author:Ron Larson, Betsy Farber
Publisher:PEARSON
The Basic Practice of Statistics
Statistics
ISBN:9781319042578
Author:David S. Moore, William I. Notz, Michael A. Fligner
Publisher:W. H. Freeman
Introduction to the Practice of Statistics
Statistics
ISBN:9781319013387
Author:David S. Moore, George P. McCabe, Bruce A. Craig
Publisher:W. H. Freeman