
College Physics
11th Edition
ISBN: 9781305952300
Author: Raymond A. Serway, Chris Vuille
Publisher: Cengage Learning
expand_more
expand_more
format_list_bulleted
Related questions
Question
Hello I need help with these questions. The graph is attached separately.

Transcribed Image Text:The image depicts a graph of \( v(t) \) against time \( t \). Below is a detailed explanation for educational purposes.
### Graph Analysis: Velocity-Time Graph
#### Axes
- **Horizontal Axis (x-axis)**: Represents time \( t \) measured in seconds (s), with values ranging from 0 to 9.
- **Vertical Axis (y-axis)**: Represents velocity \( v(t) \) measured in meters per second (m/s), with values ranging from 0 to 5.
#### Key Points and Trends
1. **Initial Phase (0 to 1 second)**:
- The graph starts at \( v(0) = 2 \) m/s.
- The velocity remains constant at 2 m/s from \( t = 0 \) to \( t = 1 \) s.
2. **Acceleration Phase (1 to 3 seconds)**:
- From \( t = 1 \) s to \( t = 3 \) s, the velocity increases linearly from 2 m/s to 4 m/s.
- This indicates a constant acceleration during this period.
3. **Constant Velocity Phase (3 to 6 seconds)**:
- From \( t = 3 \) s to \( t = 6 \) s, the velocity remains constant at 4 m/s.
- This suggests no acceleration, indicating uniform motion.
4. **Deceleration Phase (6 to 8 seconds)**:
- From \( t = 6 \) s to \( t = 8 \) s, the velocity decreases linearly from 4 m/s back to 0 m/s.
- This indicates a constant deceleration.
5. **End Phase (after 8 seconds)**:
- At \( t = 8 \) s, the velocity reaches 0 m/s and remains there for the remainder of the graph.
#### Summary
- The graph illustrates different phases of motion: initial constant velocity, acceleration, another period of constant velocity, deceleration, and finally coming to rest.
- The key to understanding this graph lies in observing the slope of the velocity-time curve, which indicates acceleration (positive slope), deceleration (negative slope), or constant velocity (zero slope).
Understanding such graphs is crucial in physics as they help in analyzing the motion of objects over time, aiding in the comprehensive study of kinematics.

Transcribed Image Text:**Physics: Velocity-Time Graphs**
### Analyzing Velocity-Time Graphs
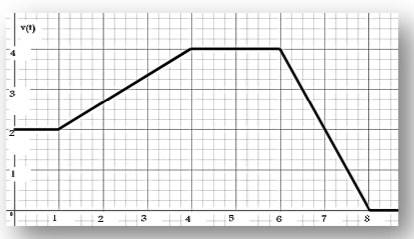
Refer to the velocity-time graph to the right, showing nine seconds in the life of a cat. All values are in standard metric units (SI) and are considered accurate to two significant figures.
#### 2. Determining Acceleration
__Question:__ What is the acceleration of the cat at \( t = 7.2 \) s?
(a) -9.8 m/s²
(b) 0.0 m/s²
(c) 0.67 m/s²
(d) -2.0 m/s²
#### 3. Calculating Average Velocity
__Question:__ What was the cat's average velocity during the first six seconds depicted in the graph?
(a) 3.2 m/s
(b) 3.0 m/s
(c) 2.6 m/s
(d) 7.5 m/s
### Detailed Explanation of the Graph
The graph displays velocity (\( v(t) \)) on the y-axis, ranging from -2 m/s to 5 m/s, and time (\( t \)) on the x-axis, ranging from 0 to 9 seconds. The graph consists of five different segments:
1. **From 0 to 1 second:** The cat moves at a constant velocity of 2 m/s.
2. **From 1 to 4 seconds:** There is a linear increase in velocity from 2 m/s to 5 m/s.
3. **From 4 to 6 seconds:** The velocity remains constant at 5 m/s.
4. **From 6 to 8 seconds:** The velocity decreases linearly from 5 m/s to -2 m/s.
5. **From 8 to 9 seconds:** The velocity remains constant at -2 m/s.
By analyzing this graph, students can answer questions related to acceleration and average velocity over specific intervals.
Expert Solution
This question has been solved!
Explore an expertly crafted, step-by-step solution for a thorough understanding of key concepts.

Step by stepSolved in 2 steps with 2 images

Knowledge Booster


Learn more about
Need a deep-dive on the concept behind this application? Look no further. Learn more about this topic, physics and related others by exploring similar questions and additional content below.Similar questions
- Can you sovle this and show steps? Also, what would the direction be of vector D x A (in terms of what)?arrow_forwardHi I was wondering how did you guys get zero for answer carrow_forwardPlot the graph T T^2(y-axin) Vs L. (X-axis) Show the straight line with data points. Label the Axés Show the equation of line on the graph + Use this equation to determine the slopeUse this slope Calcalate G Calculate % erro of G can u help me doing this partarrow_forward
- Elec X sou X Q Abc x Suck X SF Assi X ta The X A block Cchegg.coC chegg.co chegg.co The pers chegg.co + C use11fl.theexpertta.com/Common/TakeTutorialAssignment.aspx# theExpertTA.com Student bowenj@patriots.cf.edu My Account Log Out EXPERT ta Assignment Status Click here for detailed view Class Management | Help Work, Energy and power Begin Date: 2/29/2024 12:01:00 AM -- Due Date: 3/12/2024 11:59:00 PM End Date: 3/12/2024 11:59:00 PM (8%) Problem 9: A block of mass m is initially at rest at the top of an inclined plane which has a height of 4.67 m and makes an angle of 0=24.3° with respect to the horizontal. After being released, it is observed to be traveling at v=0.49 m/s a distance d after the end of the inclined plane, as shown. The coefficient of kinetic friction between the block and the plane is μp = 0.1, and the coefficient of friction on the horizontal surface is μr = 0.2. h m d m Problem Status * 50% Part (a) What is the speed of the block, in meters per second, just after it…arrow_forwardHow exactly would you solve this problem??arrow_forwardPlease see the attatched question. For question B, it needs to be drawn on a graphing paper. Please show all work and steps and explain where applicable.arrow_forward
- If quantity A is proportional to quantity B, describe how a graph of A vs B should look.arrow_forwardPlease solve the all part problem and no reject. Im needed max in 60 minutes thank uarrow_forwardProblem: given vector X = 18m, 29 degrees N of W and vector Y = 9m, 80 degress S of E Determine: X-Y (express answer in Unit vectors) *Pls answer with complete solution. *draw a graph/diagram with proper labels *THREE decimal places all final answers *enclose all final answer with a box ** I'm a little confused on how it can be solve. Can you help me? I would appreciate if you do. Thank you so mucharrow_forward
arrow_back_ios
SEE MORE QUESTIONS
arrow_forward_ios
Recommended textbooks for you
- College PhysicsPhysicsISBN:9781305952300Author:Raymond A. Serway, Chris VuillePublisher:Cengage Learning
 University Physics (14th Edition)PhysicsISBN:9780133969290Author:Hugh D. Young, Roger A. FreedmanPublisher:PEARSON
 Introduction To Quantum MechanicsPhysicsISBN:9781107189638Author:Griffiths, David J., Schroeter, Darrell F.Publisher:Cambridge University Press
  Physics for Scientists and EngineersPhysicsISBN:9781337553278Author:Raymond A. Serway, John W. JewettPublisher:Cengage Learning
 Lecture- Tutorials for Introductory AstronomyPhysicsISBN:9780321820464Author:Edward E. Prather, Tim P. Slater, Jeff P. Adams, Gina BrissendenPublisher:Addison-Wesley
 College Physics: A Strategic Approach (4th Editio...PhysicsISBN:9780134609034Author:Randall D. Knight (Professor Emeritus), Brian Jones, Stuart FieldPublisher:PEARSON
College Physics
Physics
ISBN:9781305952300
Author:Raymond A. Serway, Chris Vuille
Publisher:Cengage Learning
University Physics (14th Edition)
Physics
ISBN:9780133969290
Author:Hugh D. Young, Roger A. Freedman
Publisher:PEARSON
Introduction To Quantum Mechanics
Physics
ISBN:9781107189638
Author:Griffiths, David J., Schroeter, Darrell F.
Publisher:Cambridge University Press
Physics for Scientists and Engineers
Physics
ISBN:9781337553278
Author:Raymond A. Serway, John W. Jewett
Publisher:Cengage Learning
Lecture- Tutorials for Introductory Astronomy
Physics
ISBN:9780321820464
Author:Edward E. Prather, Tim P. Slater, Jeff P. Adams, Gina Brissenden
Publisher:Addison-Wesley
College Physics: A Strategic Approach (4th Editio...
Physics
ISBN:9780134609034
Author:Randall D. Knight (Professor Emeritus), Brian Jones, Stuart Field
Publisher:PEARSON