
MATLAB: An Introduction with Applications
6th Edition
ISBN: 9781119256830
Author: Amos Gilat
Publisher: John Wiley & Sons Inc
expand_more
expand_more
format_list_bulleted
Related questions
Topic Video
Question
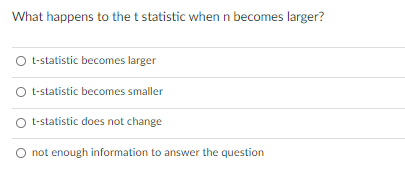

Transcribed Image Text:What happens to the t statistic when n becomes larger?
O t-statistic becomes larger
t-statistic becomes smaller
O t-statistic does not change
O not enough information to answer the question
Expert Solution
This question has been solved!
Explore an expertly crafted, step-by-step solution for a thorough understanding of key concepts.

This is a popular solution

Trending nowThis is a popular solution!

Step by stepSolved in 3 steps with 5 images

Knowledge Booster


Learn more about
Need a deep-dive on the concept behind this application? Look no further. Learn more about this topic, statistics and related others by exploring similar questions and additional content below.Similar questions
- Q1-Please help me find and understand the asnwer of the last part of this exercise. Thanks in advance.arrow_forwardPlease help me answer thisarrow_forwardGuadalajara Tours' daily sightseeing trip has a capacity of 55 people. Each day, tour officials record the number of people making the trip. The data for a selection of 22 summer days are as follows. 31, 36, 41, 42, 43, 43, 46, 46, 46, 47, 47, 49, 51, 51, 51, 51, 52, 52, 52, 54, 54, 54 Send data to calculator Send data to Excel Frequency 10 10- 6- 4 30 35 40 45 50 55 Number of people on trip O Mean (a) For these data, which measures of central tendency take more than one value? Choose all that apply. O Median OMode ONone of these measures OMean (b) Suppose that the measurement 31 (the smallest measurement in the data set) were replaced by 15. Which measures of central tondonc uld bo offoctod hv the chan OMedian Mode Explanation Check O 2021 McGraw-Hill Education. All Rights Reserved. Terms of Use Privacy Acce O Type here to search 99+ 88 4. 2.arrow_forward
- Learn with an example v Samples are drawn from a population with mean 56 and standard deviation 23. Each sample has 8 randomly and independently chosen elements. Find the mean, µz, of the distribution of sample means. Submitarrow_forwardA fitness trainer is interested in investigating whether ethnicity and the first exercise activity that members engage in are dependent. The table below shows the results of the trainer's observation of randomly selected members. Frequencies of Ethnicity and Exercise Activity Weight Machines White Hispanic Black Other Cardio 84 84 68 48 98 97 51 70 O Homogeneity O Independence Free Weights 81 98 69 41 What can be concluded at the α = 0.05 significance level? a. What is the correct statistical test to use? O Goodness-of-Fit Paired t-test b. What are the null and alternative hypotheses? Ho: O Ethnicity and first exercise activity are dependent. O Ethnicity and first exercise activity are independent. O The distribution of first exercise activity is not the same for each ethnicity. O The distribution of first exercise activity is the same for each ethnicity. H₁: O The distribution of first exercise activity is the same for each ethnicity. O Ethnicity and first exercise activity are…arrow_forwardanswer multiple choicesarrow_forward
- The table below shows the mean number of daily errors by air traffic controller trainees during the first two weeks on the job. We want to perform a paired t-test at a = .05 to see if the mean daily errors decreased significantly Trainee T1 T2 T3 T4 T5 T6 T7 Week 1 5.1 3. 12.1 6.2 11.5 7.8 2.2 Week 2 3.2 2.2 8.7 7.7 9.4 7.8 3.1 The test statistic is; O 1.25 O 1.75 O 0.87 O 0.79arrow_forwardQuestion: There choose one (is/is not) enough evidence to conclude that the mean weight is choose one (more than/less than/ different than) 75 pounds.arrow_forward☐True ☐False Statisticalpower is about your observed statistic (e.g., z,t). The further away from zero your statistic is, the more powerful your study is.arrow_forward
- Gender and Frequency of Status Updates on Facebook The Pew Research Center conducted a survey of randomly sampled American adults, asking them about their use of social networking sites such as Facebook. The table below shows the self-reported frequency of status updates on Facebook by gender. Are frequency of status updates and gender related? chi-square statistic = i p-value = i Conclusion: ĮStatus/Gender Ho- Every day 3 - 5 days/week 1 - 2 days/week Every few weeks Less often Total Male Female Total 42 46 70 77 88 386 59 79 79 151 186 491 130 105 149 Round your answer for the chi-square statistic to one decimal place, and your answer for the p-value to three decimal places. 156 337 877 Table 1 Gender and frequency of status updates on Facebookarrow_forwardData of variable-A is collected as shown to the right. Is the mean of Variable-A less than 80? State null hypothesis and choose level of significance, a = 0.05. (Use Excel ttest function, provide clear logic and reasoning.) Variable-A Variable-B 78.8 81.9 76.9 78.0 67.8 69.7 68.9 74.7 70.5 70.0 80.0 68.2 63.0 88.7 78.7 86.7 85.4 69.5 87.0 75.1 82.4 71.8 78.2 58.1 76.9 74.8 60.2 93.2 82.6 84.6 67.2 66.5 71.7 77.2 68.9 74.0 69.3 77.7 89.1 78.6 76.3 68.3 74.0 89.0 69.4 82.1 76.3 78.0 66.2 80.3 73.9 82.4 79.1 83.1 80.4 66.4 66.2 67.6 80.9 75.3arrow_forwardHow many caffeine drinks per day Count of how many caffeine drinks per day 3 61 2 54 4 38 1 31 0 27 5 23 6 14 7 5 8 5 10 1 2.5 1 1.5 1 9 1 Grant total 262 Calculate the mean, standard deviation, and variance for the variable “How many caffeine drinks per day”. What is the median and range “How many caffeine drinks per day” Determine the first quartile (Q1), third quartile (Q3), and interquartile range (IQR) for the variable “How many caffeine drinks per day”. Calculate the lower and upper limits using the quartile method to determine if there are any outliers for the variable “How many caffeine drinks per day”. Calculate the lower and upper limits using the standard deviation method to determine if there are any outliers for the variable “How many caffeine drinks per day”.arrow_forward
arrow_back_ios
SEE MORE QUESTIONS
arrow_forward_ios
Recommended textbooks for you
- MATLAB: An Introduction with ApplicationsStatisticsISBN:9781119256830Author:Amos GilatPublisher:John Wiley & Sons Inc
 Probability and Statistics for Engineering and th...StatisticsISBN:9781305251809Author:Jay L. DevorePublisher:Cengage Learning
 Statistics for The Behavioral Sciences (MindTap C...StatisticsISBN:9781305504912Author:Frederick J Gravetter, Larry B. WallnauPublisher:Cengage Learning
  Elementary Statistics: Picturing the World (7th E...StatisticsISBN:9780134683416Author:Ron Larson, Betsy FarberPublisher:PEARSON
 The Basic Practice of StatisticsStatisticsISBN:9781319042578Author:David S. Moore, William I. Notz, Michael A. FlignerPublisher:W. H. Freeman
 Introduction to the Practice of StatisticsStatisticsISBN:9781319013387Author:David S. Moore, George P. McCabe, Bruce A. CraigPublisher:W. H. Freeman
MATLAB: An Introduction with Applications
Statistics
ISBN:9781119256830
Author:Amos Gilat
Publisher:John Wiley & Sons Inc
Probability and Statistics for Engineering and th...
Statistics
ISBN:9781305251809
Author:Jay L. Devore
Publisher:Cengage Learning
Statistics for The Behavioral Sciences (MindTap C...
Statistics
ISBN:9781305504912
Author:Frederick J Gravetter, Larry B. Wallnau
Publisher:Cengage Learning
Elementary Statistics: Picturing the World (7th E...
Statistics
ISBN:9780134683416
Author:Ron Larson, Betsy Farber
Publisher:PEARSON
The Basic Practice of Statistics
Statistics
ISBN:9781319042578
Author:David S. Moore, William I. Notz, Michael A. Fligner
Publisher:W. H. Freeman
Introduction to the Practice of Statistics
Statistics
ISBN:9781319013387
Author:David S. Moore, George P. McCabe, Bruce A. Craig
Publisher:W. H. Freeman