ENGR.ECONOMIC ANALYSIS
14th Edition
ISBN: 9780190931919
Author: NEWNAN
Publisher: Oxford University Press
expand_more
expand_more
format_list_bulleted
Question
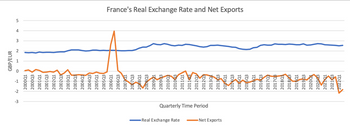
What does this graph show and what is the relationship between real exchange rate and net exports?

Transcribed Image Text:-Real Exchange Rate
-Net Exports
Quarterly Time Period
úŃ
2000Q1
2000Q3
2001Q1
2001Q3
2002Q1
2002Q3
2003Q1
2003Q3
2004Q1
2004Q3
2005Q1
2005Q3
2006Q1
2006Q3
2007Q1
2007Q3
2008Q1
2008Q3
200901
200903
201001
201003
2011Q1
201103
201201
201203
201301
201303
2014Q1
201403
2015Q1
2015 Q3
2016Q1
2016Q3
2017Q1
201703
201801
201803
2019Q1
201903
202001
202003
2021Q1
202103
2022Q1
GBP/EUR
51
France's Real Exchange Rate and Net Exports
Expert Solution
This question has been solved!
Explore an expertly crafted, step-by-step solution for a thorough understanding of key concepts.
Step by stepSolved in 3 steps

Knowledge Booster
Learn more about
Need a deep-dive on the concept behind this application? Look no further. Learn more about this topic, economics and related others by exploring similar questions and additional content below.Similar questions
- Please answer fast i give you upvote.arrow_forwardSuppose you observe the following exchange rates and interest rates for the USD and JPY: Bid Ask USD/JPY 105.20 105.95 USD,JPY F,360 104.25 105.10 Trader lends at Trader borrows at I USD ? ? I JPY 1.40% 1.50% Which answer is closest to the maximum US lending rate that prevents covered interest rate arbitrage? 3.21% 3.16% 3.05% 2.32% 2.42%arrow_forwardIf the value of the dollar appreciates in value relative to other currencies, this means the dollar becomes "stronger", how are the following groups affected. Please explain your answers. US Importers, hurt or helped? US Exporters, hurt or helped? Will this strengthening of the dollar cause GDP to increase or decrease?arrow_forward
- A country with higher nominal interest rates than its trading partners will see its exchange rate depreciate in value relative to the currencies of its trading partners in the long run. Is this statement true or false? Briefly explain why.arrow_forwardWe saw in class that PPP conversion factors are different from market exchange rates because they are based on the actual purchasing powers of currencies. The table below shows the GDP of different countries in their local currency along with their GDP at the market exchange rate, population, and the PPP conversion factor. country GDP in 2017 GDP (US$s, at market ex.) PPP factor роpulation Japan 544¥ trillion $4.86 trillion 105 ¥/$ 127.5 million India 1717 trillion $2.65 trillion 20 7/$ 1339 million |Мexico 22 trillion pesos $1.16 trillion 11 pesos/$ 129 million Which country has the higher GDP per capita measured in purchasing power, India or Mexico? Mexico's average income is more than double India's India's average income is more than double Mexico's Mexico and India have similar average incomes not enough information is providedarrow_forward
arrow_back_ios
arrow_forward_ios
Recommended textbooks for you

 Principles of Economics (12th Edition)EconomicsISBN:9780134078779Author:Karl E. Case, Ray C. Fair, Sharon E. OsterPublisher:PEARSON
 Engineering Economy (17th Edition)EconomicsISBN:9780134870069Author:William G. Sullivan, Elin M. Wicks, C. Patrick KoellingPublisher:PEARSON
 Principles of Economics (MindTap Course List)EconomicsISBN:9781305585126Author:N. Gregory MankiwPublisher:Cengage Learning
 Managerial Economics: A Problem Solving ApproachEconomicsISBN:9781337106665Author:Luke M. Froeb, Brian T. McCann, Michael R. Ward, Mike ShorPublisher:Cengage Learning
 Managerial Economics & Business Strategy (Mcgraw-...EconomicsISBN:9781259290619Author:Michael Baye, Jeff PrincePublisher:McGraw-Hill Education


Principles of Economics (12th Edition)
Economics
ISBN:9780134078779
Author:Karl E. Case, Ray C. Fair, Sharon E. Oster
Publisher:PEARSON

Engineering Economy (17th Edition)
Economics
ISBN:9780134870069
Author:William G. Sullivan, Elin M. Wicks, C. Patrick Koelling
Publisher:PEARSON

Principles of Economics (MindTap Course List)
Economics
ISBN:9781305585126
Author:N. Gregory Mankiw
Publisher:Cengage Learning

Managerial Economics: A Problem Solving Approach
Economics
ISBN:9781337106665
Author:Luke M. Froeb, Brian T. McCann, Michael R. Ward, Mike Shor
Publisher:Cengage Learning

Managerial Economics & Business Strategy (Mcgraw-...
Economics
ISBN:9781259290619
Author:Michael Baye, Jeff Prince
Publisher:McGraw-Hill Education