MATLAB: An Introduction with Applications
6th Edition
ISBN: 9781119256830
Author: Amos Gilat
Publisher: John Wiley & Sons Inc
expand_more
expand_more
format_list_bulleted
Question
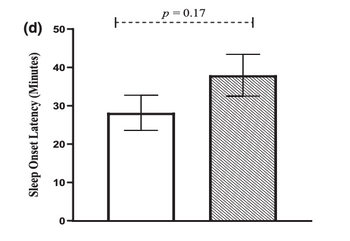
What does the p in the image tell us about the graph? From looking at the graph what could be the

Transcribed Image Text:(d)
Sleep Onset Latency (Minutes)
50-
40-
30-
20-
10-
0
P = 0.17
Expert Solution
This question has been solved!
Explore an expertly crafted, step-by-step solution for a thorough understanding of key concepts.
Step by stepSolved in 4 steps

Knowledge Booster
Similar questions
- Choose the best statement to summarize the association shown between hat size and IQ in the scatterplot below. Hat Size O The scatterplot does not show a trend that would indicate an association between hat size and IQ scores. O As hat size increases, IQ scores tend to decrease. O As hat size increases, IQ scores tend to increase. Hat size causes IQ to increase.arrow_forwardIf too large a scale is used on a graph, it can be misleading when trying to interpret the data. O True O Falsearrow_forwardWhat value should go in the overlap of the two circles? (that's where the 'X' is). Explain your reasoningarrow_forward
- Fitting a straight line to a set of data yields the prediction line Yi=2+4Xi. The values of X used to find the prediction line range from 2 to 28. c. Should this model be used to predict the mean value of Y when X equals 0? yes, no, not enough information ? d. Should this model be used to predict the mean value of Y when X equals 27? yes, no, not enough information?arrow_forwardThe interquartile range is more susceptible to outliers in the data than is the range A. True B. Falsearrow_forwardIf we multiply the data values by a constant (say, c), how this will affect the geometric mean? Use the equation in image to prove it, and give an example.arrow_forward
- How did you calcualte the mean for the first partarrow_forwardSuppose the mean of X is 94. What does the mean of X become if you multiply X by 1.22? (Use two decimal places, ex: 12.34)arrow_forwardFor exercise 1. What is the standard error of these measurements and mean value? I have attached example 3arrow_forward
arrow_back_ios
arrow_forward_ios
Recommended textbooks for you
 MATLAB: An Introduction with ApplicationsStatisticsISBN:9781119256830Author:Amos GilatPublisher:John Wiley & Sons Inc
 Probability and Statistics for Engineering and th...StatisticsISBN:9781305251809Author:Jay L. DevorePublisher:Cengage Learning
 Statistics for The Behavioral Sciences (MindTap C...StatisticsISBN:9781305504912Author:Frederick J Gravetter, Larry B. WallnauPublisher:Cengage Learning
 Elementary Statistics: Picturing the World (7th E...StatisticsISBN:9780134683416Author:Ron Larson, Betsy FarberPublisher:PEARSON
 The Basic Practice of StatisticsStatisticsISBN:9781319042578Author:David S. Moore, William I. Notz, Michael A. FlignerPublisher:W. H. Freeman
 Introduction to the Practice of StatisticsStatisticsISBN:9781319013387Author:David S. Moore, George P. McCabe, Bruce A. CraigPublisher:W. H. Freeman

MATLAB: An Introduction with Applications
Statistics
ISBN:9781119256830
Author:Amos Gilat
Publisher:John Wiley & Sons Inc

Probability and Statistics for Engineering and th...
Statistics
ISBN:9781305251809
Author:Jay L. Devore
Publisher:Cengage Learning

Statistics for The Behavioral Sciences (MindTap C...
Statistics
ISBN:9781305504912
Author:Frederick J Gravetter, Larry B. Wallnau
Publisher:Cengage Learning

Elementary Statistics: Picturing the World (7th E...
Statistics
ISBN:9780134683416
Author:Ron Larson, Betsy Farber
Publisher:PEARSON

The Basic Practice of Statistics
Statistics
ISBN:9781319042578
Author:David S. Moore, William I. Notz, Michael A. Fligner
Publisher:W. H. Freeman

Introduction to the Practice of Statistics
Statistics
ISBN:9781319013387
Author:David S. Moore, George P. McCabe, Bruce A. Craig
Publisher:W. H. Freeman