
MATLAB: An Introduction with Applications
6th Edition
ISBN: 9781119256830
Author: Amos Gilat
Publisher: John Wiley & Sons Inc
expand_more
expand_more
format_list_bulleted
Related questions
Question
What are the means? The standard deviations? Compare the mean with the standard deviation for each variable. Does there appear to be more variability in the crimes or in police expenditures per capita in these states? Which states contribute more to this greater variability?

Transcribed Image Text:nz
zie
Hon
ilton
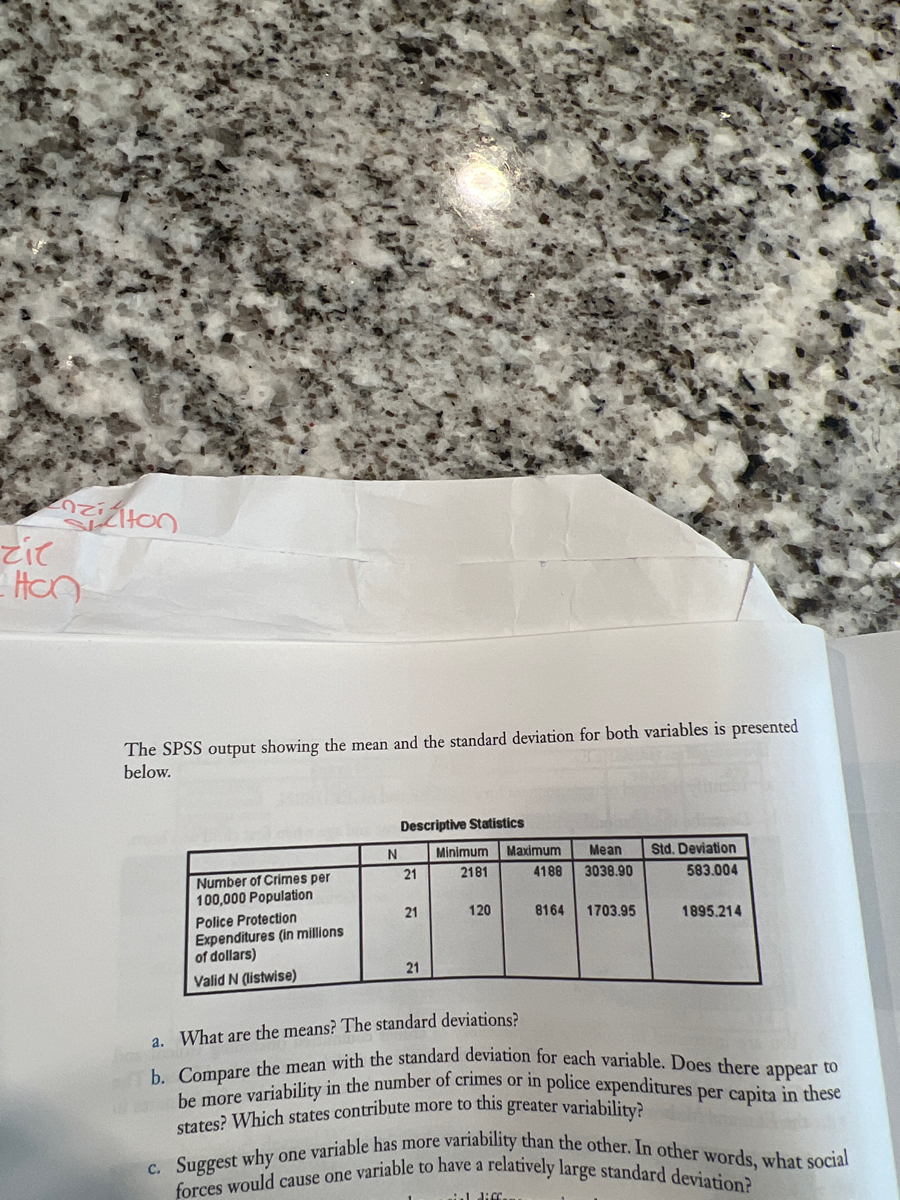
The SPSS output showing the mean and the standard deviation for both variables is presented
below.
Number of Crimes per
100,000 Population
Police Protection
Expenditures (in millions
of dollars)
Valid N (listwise)
N
Descriptive Statistics
21
21
21
Minimum
2181
120
Maximum Mean Std. Deviation
4188
3038.90
583.004
8164 1703.95
1895.214
a. What are the means? The standard deviations?
b. Compare the mean with the standard deviation for each variable. Does there appear to
be more variability in the number of crimes or in police expenditures per capita in these
states? Which states contribute more to this greater variability?
il diffams
c. Suggest why one variable has more variability than the other. In other words, what social
forces would cause one variable to have a relatively large standard deviation?

Transcribed Image Text:es of
ution
ith a
the
12-
w.
five categories (DEGREE).
for respondent's age when first child was born (AGEKDBRN) is reported for
Identify the level of measurement for DEGREE and AGEKDBRN.
a.
b. Describe the relationship between respondent degree and age when first child was born.
Mean
Standard deviation
Variance
State
Maine
New Hampshire
Vermont
Massachusetts
Rhode Island
Connecticut
New York
New Jersey
Pennsylvania
Less Than
High School
Ohio
Indiana
Illinois
Michigan
Wisconsin
Minnesota
20.72
lowa
Missouri
North Dakota
South Dakota
Nebraska
Kansas
4.745
22.512
High
School
23.34
5.542
30,709
Some
College
23.46
9. You are interested in studying the variability of crimes committed (including violent and
property crimes) and police expenditures in the eastern and Midwestern United States. The
U.S. Census Bureau collected the following statistics on these two variables for 21 states in
the East and Midwest in 2008.
Number of Crimes per
100,000 Population
5.575
31.082
Police Protection Expenditures
(in Millions of Dollars)
2,583
233
2,384
317
2,761
141
2,860
1,843
3,098
317
2,798
996
2,407
8,164
2,618
3,087
2,842
2,840
3,982
3,157
3,947
1,223
3,498
4,242
3,492
2,425
3,047
1,552
2,893
1,527
2,820
614
4,188
1,632
2,343
120
2,181
141
528
3,275
684
3,800
Source: U.S. Census Bureau, Statistical Abstract of the United States: 2012, Tables 308 and 443.
Notes:
Bachelor's
Degree
27.98
a. Limited data for Illinois during 2008 were available.
b. Limited data for Minnesota during 2008 were available.
6.185
38.259
Graduate
Degree
28.99
6.205
38.496
CHAPTER 4 Measures of Variability
Expert Solution
This question has been solved!
Explore an expertly crafted, step-by-step solution for a thorough understanding of key concepts.

This is a popular solution

Trending nowThis is a popular solution!

Step by stepSolved in 3 steps

Knowledge Booster

Similar questions
- Can you find the mean and the standard deviation?arrow_forwardBriefly explain the difference between the concepts of mean and median and the advantages and disadvantages of both measures. Which variable has a larger standard deviation? Discuss what this statistic measures and what it tells you about this variable. If someone’s score is 1 standard deviation above the mean for study hours (+1 Z score), how many hours do they study? If a friend is 1 standard deviation below the mean for work hours (-1 Z score), how many hours do they work?arrow_forwardWhich is the largest with regard to the following data set: the range or the standard deviation? 11 11 12 12 12 12 13 15 17 22 22 22 Standard Deviation Rangearrow_forward
- A survey collected the data below. x 26 4 16 12 20 The mean is 15.6. Calculate the deviation of x=16 ?arrow_forwardA successful basketball player has a height of 6 feet 11 inches, or 211 cm. Based on statistics from a data set, his height converts to the z score of 5.17. How many standard deviations is his height above the mean?arrow_forwardWhich of these is an advantage of using a transformed score when reporting the score of an individual case? a. Transformed scores will allow the mean score to be reported. b. Transformed scores will be reported on the nominal level. c. Transformed scores provide a context for the individual's score d. Transformed scores provide a measure of variability.arrow_forward
- z Scores LeBron James, one of the most successful basketball players of all time, has a height of 6 feet 8 inches, or 203 cm. Based on statistics from Data Set 1 “Body Data” in Appendix B, his height converts to the z score of 4.07. How many standard deviations is his height above the mean?arrow_forwardGiven that the mean and standard deviation are $24 and $3. Calculate the variance.arrow_forward
arrow_back_ios
arrow_forward_ios
Recommended textbooks for you
- MATLAB: An Introduction with ApplicationsStatisticsISBN:9781119256830Author:Amos GilatPublisher:John Wiley & Sons Inc
 Probability and Statistics for Engineering and th...StatisticsISBN:9781305251809Author:Jay L. DevorePublisher:Cengage Learning
 Statistics for The Behavioral Sciences (MindTap C...StatisticsISBN:9781305504912Author:Frederick J Gravetter, Larry B. WallnauPublisher:Cengage Learning
  Elementary Statistics: Picturing the World (7th E...StatisticsISBN:9780134683416Author:Ron Larson, Betsy FarberPublisher:PEARSON
 The Basic Practice of StatisticsStatisticsISBN:9781319042578Author:David S. Moore, William I. Notz, Michael A. FlignerPublisher:W. H. Freeman
 Introduction to the Practice of StatisticsStatisticsISBN:9781319013387Author:David S. Moore, George P. McCabe, Bruce A. CraigPublisher:W. H. Freeman
MATLAB: An Introduction with Applications
Statistics
ISBN:9781119256830
Author:Amos Gilat
Publisher:John Wiley & Sons Inc
Probability and Statistics for Engineering and th...
Statistics
ISBN:9781305251809
Author:Jay L. Devore
Publisher:Cengage Learning
Statistics for The Behavioral Sciences (MindTap C...
Statistics
ISBN:9781305504912
Author:Frederick J Gravetter, Larry B. Wallnau
Publisher:Cengage Learning
Elementary Statistics: Picturing the World (7th E...
Statistics
ISBN:9780134683416
Author:Ron Larson, Betsy Farber
Publisher:PEARSON
The Basic Practice of Statistics
Statistics
ISBN:9781319042578
Author:David S. Moore, William I. Notz, Michael A. Fligner
Publisher:W. H. Freeman
Introduction to the Practice of Statistics
Statistics
ISBN:9781319013387
Author:David S. Moore, George P. McCabe, Bruce A. Craig
Publisher:W. H. Freeman