
Algebra and Trigonometry (6th Edition)
6th Edition
ISBN: 9780134463216
Author: Robert F. Blitzer
Publisher: PEARSON
expand_more
expand_more
format_list_bulleted
Related questions
Question
The table below shows the weight in kg of fifty students.
A. Calculate the mean, median, mode, and range.
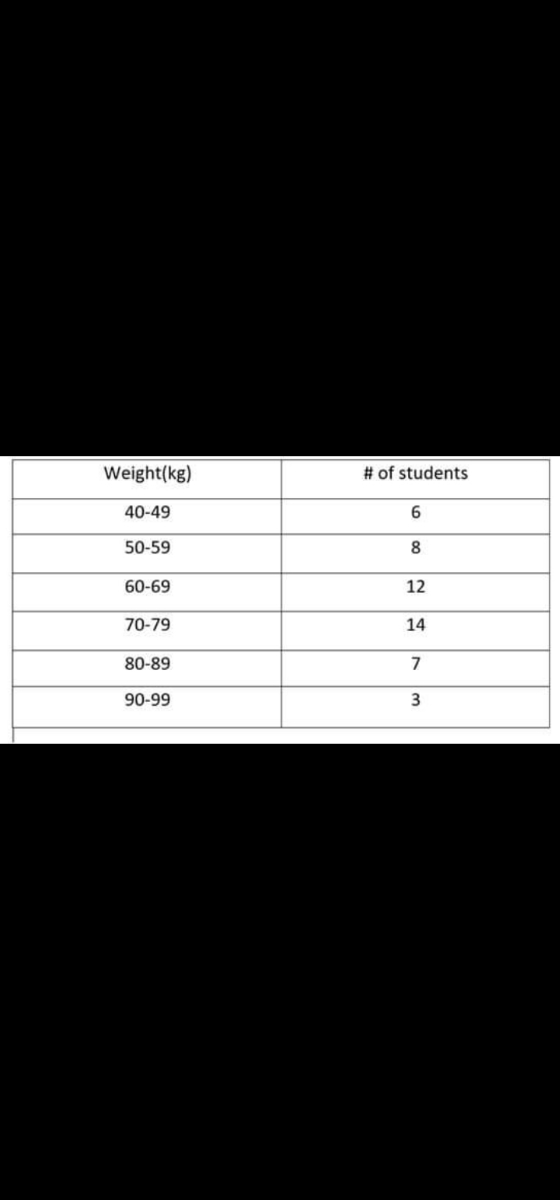

Transcribed Image Text:Weight(kg)
# of students
40-49
6
50-59
8
60-69
12
70-79
14
80-89
90-99
3
Expert Solution
This question has been solved!
Explore an expertly crafted, step-by-step solution for a thorough understanding of key concepts.

Step by stepSolved in 6 steps with 6 images

Knowledge Booster

Similar questions
- state whether the parameter of interest is a mean or a proportion: in a survey, high school and college students are asked whether or not they use geolocation services on their smart phones.arrow_forwardConsider the data set: 7 8 4 2 1 3 9 3 Find the mean: (Round your answer to 3 decimal places if necessary) Find the median: (Round your answer to 3 decimal places if necessary)arrow_forwardA sales manager recorded the number of sales made by each of the 300 salespeople working athis chain of furniture outlet stores on a Saturday and created the following table.# Sales (bins) Proportion of salespeople in this bin0 – 3 0.053 – 6 0.156 – 9 0.30 9 – 12 0.3512 -15 0.15a. What is the unit of observation in this sample?b. What is the variable collected?c. Draw and label the histogram for this dataset.d. Which is the modal category?e. Calculate the proportion of the salespeople made 9 or more sales.f. Calculate the number of salespeople who made between 0 and 9 sales.arrow_forward
- The top 14 speeds, in miles per hour, for professional drag racing over the past two decades are listed below. Find the median speed. 181.1 202.2 190.1 201.4 201.2 193.2 201.2 194.5 A. 196.1 B. 196.7 C. 201.2 D. 195.8 191.3 201.4 199.2 192.2 196.0 196.2arrow_forward5: Cal Poly has a vested interest in finding out the level to which its students are content with the various courses offered. They are curious to learn what proportion of students are pleased with the courses they are enrolled in at the moment. The provost believes that 27 % of Cal Poly students are pleased with the courses. A group was asked in front of the library if they were content with the various courses offered. Out of the 113 students asked, 31 students were content with the various courses offeredarrow_forwardMarc takes a random sample of 14 dogs from the local animal shelter and weighs them. He obtains the following data: 9 25 32 40 41 45 47 50 53 53 62 79 94 106 What is the median for this data?arrow_forward
- Find the mean of the data summarized in the given frequency distribution table below. Score students 50-59 5 60-69 8 70-79 5 80-89 5 90-99 17arrow_forwardA teacher surveyed 11 students for how many days per week they have read newspaper. The result is shown as follows: 1 1 1 2 2 2 2 5 6 6 6 (a) Find the mean. (b) Find the median. (c) Find the mode.arrow_forwardThe data below are the frequency of cremation burials found in 17 archaeological sites. a. Obtain the mean, median, and mode of these data. b. Which measure of center do you think works best here? 83 69 44 49 516 34 33 281 2340 44 371 27 89 430 58 242 122 a. The mean isarrow_forward
arrow_back_ios
arrow_forward_ios
Recommended textbooks for you
- Algebra and Trigonometry (6th Edition)AlgebraISBN:9780134463216Author:Robert F. BlitzerPublisher:PEARSON
 Contemporary Abstract AlgebraAlgebraISBN:9781305657960Author:Joseph GallianPublisher:Cengage Learning
 Linear Algebra: A Modern IntroductionAlgebraISBN:9781285463247Author:David PoolePublisher:Cengage Learning
  Algebra And Trigonometry (11th Edition)AlgebraISBN:9780135163078Author:Michael SullivanPublisher:PEARSON
 Introduction to Linear Algebra, Fifth EditionAlgebraISBN:9780980232776Author:Gilbert StrangPublisher:Wellesley-Cambridge Press
 College Algebra (Collegiate Math)AlgebraISBN:9780077836344Author:Julie Miller, Donna GerkenPublisher:McGraw-Hill Education
Algebra and Trigonometry (6th Edition)
Algebra
ISBN:9780134463216
Author:Robert F. Blitzer
Publisher:PEARSON
Contemporary Abstract Algebra
Algebra
ISBN:9781305657960
Author:Joseph Gallian
Publisher:Cengage Learning
Linear Algebra: A Modern Introduction
Algebra
ISBN:9781285463247
Author:David Poole
Publisher:Cengage Learning
Algebra And Trigonometry (11th Edition)
Algebra
ISBN:9780135163078
Author:Michael Sullivan
Publisher:PEARSON
Introduction to Linear Algebra, Fifth Edition
Algebra
ISBN:9780980232776
Author:Gilbert Strang
Publisher:Wellesley-Cambridge Press
College Algebra (Collegiate Math)
Algebra
ISBN:9780077836344
Author:Julie Miller, Donna Gerken
Publisher:McGraw-Hill Education