
MATLAB: An Introduction with Applications
6th Edition
ISBN: 9781119256830
Author: Amos Gilat
Publisher: John Wiley & Sons Inc
expand_more
expand_more
format_list_bulleted
Related questions
Question
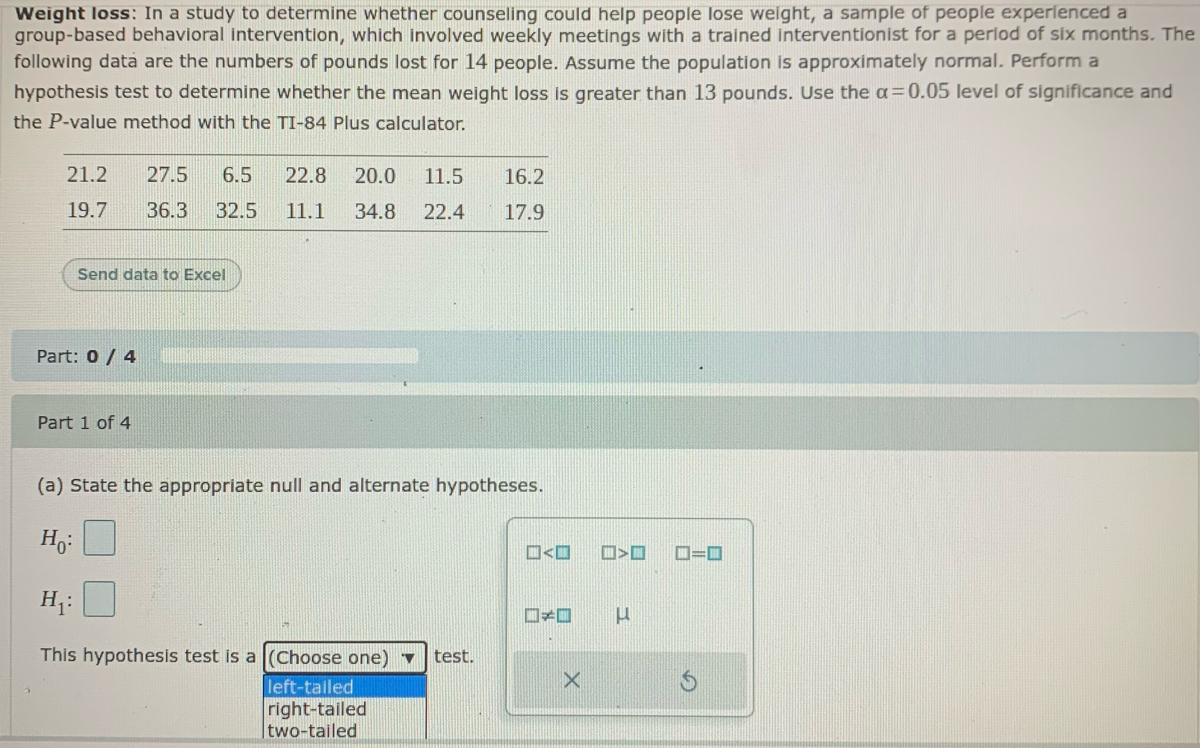
Weight loss: In a study to determine whether counseling could help people lose weight, a sample of people experienced a
group-based behavioral intervention, which involved weekly meetings with a trained interventionist for a period of six months. The
following data are the numbers of pounds lost for 14 people. Assume the population is approximately normal. Perform a
hypothesis test to determine whether the mean weight loss is greater than 13 pounds. Use the a=0.05 level of significance and
the P-value method with the TI-84 Plus calculator.

Transcribed Image Text:Weight loss: In a study to determine whether counseling could help people lose welght, a sample of people experlenced a
group-based behavioral intervention, which involved weekly meetings with a trained interventionist for a perlod of six months. The
following data are the numbers of pounds lost for 14 people. Assume the population is approximately normal. Perform a
hypothesis test to determine whether the mean weight loss is greater than 13 pounds. Use the a=0.05 level of significance and
the P-value method with the TI-84 Plus calculator.
21.2
27.5
6.5
22.8
20.0
11.5
16.2
19.7
36.3
32.5
11.1
34.8
22.4
17.9
Send data to Excel
Part: 0 / 4
Part 1 of 4
(a) State the appropriate null and alternate hypotheses.
O<O
D=D
H7:
ローロ
This hypothesis test is a (Choose one) ▼
test.
left-tailed
right-tailed
two-tailed

Transcribed Image Text:College tuition: The mean annual tuition and fees in the 2013-2014 academic year for a sample of 13 private colleges in
California was $38,000 with a standard deviation of $7900. A dotplot shows that it is reasonable to assume that the population is
approximately normal. Can you conclude that the mean tuition and fees for private institutions in California differs from $35,0007
Use the a = 0.01 level of significance and the P-value method with the TI-84 Plus calculator.
Part: 0/4
Part 1 of 4
State the appropriate null and alternate hypotheses.
D-O
This hypothesis test is a (Choose one)
test.
left-tailed
right-talled
two-taled
Part 2 of 4
Compute the P-value. Round the P-value to at least four decimal places.
P-value =
Part 3 of 4
Determine whether to reject H
(Choose one)
the null hypothesis Ho-
Reject
Do not reject
Expert Solution
This question has been solved!
Explore an expertly crafted, step-by-step solution for a thorough understanding of key concepts.

This is a popular solution

Trending nowThis is a popular solution!

Step by stepSolved in 2 steps with 2 images

Knowledge Booster

Similar questions
- Individual actions can play a large role in the overall health of our planet. A researcher interested in evaluating environment friendly behaviors evaluated how often people recycle (per month) based on whether they have an overall optimistic or an overall pessimistic attitude toward eco-friendly behaviors. The results from this hypothetical study are given in the table. Test whether or not recycling behaviors differed between groups using a .05 level of significance. State the value of the test statistics and the decision to retain or reject the null hypothesis. Compute effect size using eta- squared (n^2). Pessimistic Optimistic 3 4 0 9 4 6 2 8 1 9 6 5 3 6 5 8 0 6 5 7arrow_forwardAcne is a common skin disease that affects most adolescents and can continue into adulthood. A study compared the effectiveness of three acne treatments and a placebo, all in gel form, applied twice daily for 12 weeks. The study's 517 teenage volunteers were randomly assigned to one of the four treatments. Success was assessed as clear or almost clear skin at the end of the 12 week period. The results of the study can be seen in the table below. Using the appropriate statistical test, determine if there is significant evidence that the four treatments perform differently. If so, how do they compare.arrow_forwardThe table below lists body temperatures obtained randomly selected subjects. The temperatures are categorized according to gender and whether the subject uses drug. Using a 0.05 significance level, test for an interaction between gender and usage of drug, test for an effect from gender, and test for an effect from usage of drug. What do you conclude? Use Drug Does Not Use Drug Male 98.4 97.4 96.8 98.2 98.4 97.4 97.4 98.0 Female 98.6 99.3 98.2 98.6 97.0 98.4 97.2 98.7arrow_forward
- A software company is interested in improving customer satisfaction rate from the 60% currently claimed. The company sponsored a survey of 148 customers and found that 95 customers were satisfied. What is the test statistic z?arrow_forwardIn general, why does using a repeated-measures ANOVA increase statistical power compared to using a one-way between-groups ANOVA? Group of answer choices: a.MSbetween is lower b.MSerror is higher c.MSerror is lower d.MSbetween is higherarrow_forwardA poll was conducted to investigate opinions about global warming. The respondents who answered yes when asked if there is solid evidence that the earth is getting warmer were then asked to select a cause of global warming. The results are given in the accompanying data table. Use a 0.01 significance level to test the claim that the sex of the respondent is independent of the choice for the cause of global warming. Do men and women appear to agree, or is there a substantial difference? 9 Human activity Natural patterns Don't know 66 64 Male 288 307 130 155 Female Click here to view the chi-square distribution table. Identify the null and alternative hypotheses. Ho: H₂₁: Compute the test statistic. ▼and and (Round to three decimal places as needed.) Find the critical value(s). are ▼are (Round to three decimal places as needed. Use a comma to separate answers as needed.) What is the conclusion based on the hypothesis test? Ho. There sufficient evidence to warrant rejection of the claim…arrow_forward
arrow_back_ios
arrow_forward_ios
Recommended textbooks for you
- MATLAB: An Introduction with ApplicationsStatisticsISBN:9781119256830Author:Amos GilatPublisher:John Wiley & Sons Inc
 Probability and Statistics for Engineering and th...StatisticsISBN:9781305251809Author:Jay L. DevorePublisher:Cengage Learning
 Statistics for The Behavioral Sciences (MindTap C...StatisticsISBN:9781305504912Author:Frederick J Gravetter, Larry B. WallnauPublisher:Cengage Learning
  Elementary Statistics: Picturing the World (7th E...StatisticsISBN:9780134683416Author:Ron Larson, Betsy FarberPublisher:PEARSON
 The Basic Practice of StatisticsStatisticsISBN:9781319042578Author:David S. Moore, William I. Notz, Michael A. FlignerPublisher:W. H. Freeman
 Introduction to the Practice of StatisticsStatisticsISBN:9781319013387Author:David S. Moore, George P. McCabe, Bruce A. CraigPublisher:W. H. Freeman
MATLAB: An Introduction with Applications
Statistics
ISBN:9781119256830
Author:Amos Gilat
Publisher:John Wiley & Sons Inc
Probability and Statistics for Engineering and th...
Statistics
ISBN:9781305251809
Author:Jay L. Devore
Publisher:Cengage Learning
Statistics for The Behavioral Sciences (MindTap C...
Statistics
ISBN:9781305504912
Author:Frederick J Gravetter, Larry B. Wallnau
Publisher:Cengage Learning
Elementary Statistics: Picturing the World (7th E...
Statistics
ISBN:9780134683416
Author:Ron Larson, Betsy Farber
Publisher:PEARSON
The Basic Practice of Statistics
Statistics
ISBN:9781319042578
Author:David S. Moore, William I. Notz, Michael A. Fligner
Publisher:W. H. Freeman
Introduction to the Practice of Statistics
Statistics
ISBN:9781319013387
Author:David S. Moore, George P. McCabe, Bruce A. Craig
Publisher:W. H. Freeman