
MATLAB: An Introduction with Applications
6th Edition
ISBN: 9781119256830
Author: Amos Gilat
Publisher: John Wiley & Sons Inc
expand_more
expand_more
format_list_bulleted
Related questions
Question
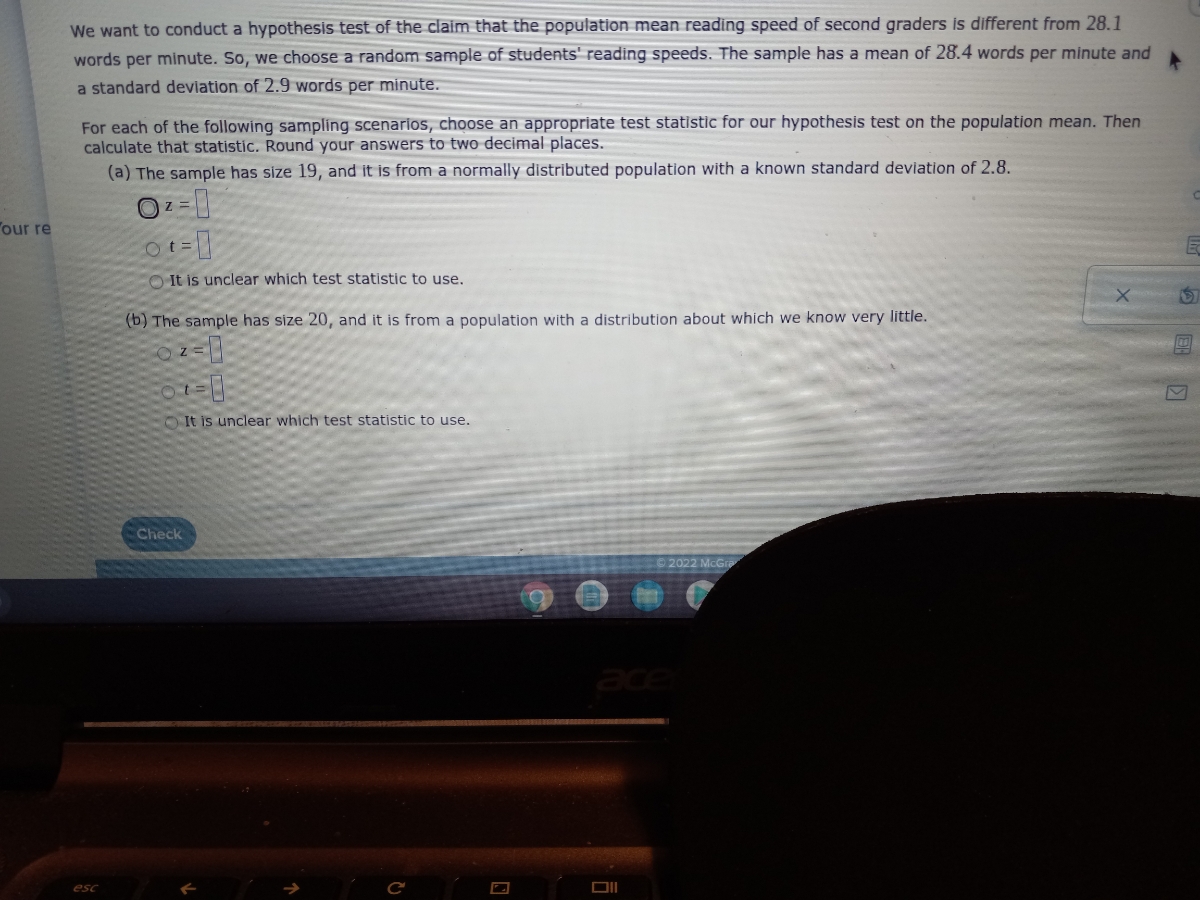

Transcribed Image Text:We want to conduct a hypothesis test of the claim that the population mean reading speed of second graders is different from 28.1
words per minute. So, we choose a random sample of students' reading speeds. The sample has a mean of 28.4 words per minute and
a standard deviation of 2.9 words per minute.
For each of the following sampling scenarios, choose an appropriate test statistic for our hypothesis test on the population mean. Then
calculate that statistic. Round your answers to two decimal places.
(a) The sample has size 19, and it is from a normally distributed population with a known standard deviation of 2.8.
"our re
Ot =
O It is unclear which test statistic to use.
(b) The sample has size 20, and it is from a population with a distribution about which we know very little.
O It is unclear which test statistic to use.
Check
© 2022 McGra
ace
Expert Solution
This question has been solved!
Explore an expertly crafted, step-by-step solution for a thorough understanding of key concepts.

Step by stepSolved in 3 steps with 1 images

Knowledge Booster

Similar questions
- You are testing the claim that the mean GPA of night students is different from the mean GPA of day students. You sample 20 night students, and the sample mean GPA is 2.85 with a standard deviation of 0.86. You sample 30 day students, and the sample mean GPA is 3.02 with a standard deviation of 0.4. Test the claim using a 5% level of significance. Assume the population standard deviations are unequal and that GPAs are normally distributed. Give answer to at least 4 decimal places. What are the correct hypotheses?H0: = H1: Based on the hypotheses, find the following:Test Statistic = p− value = The correct decision is to The correct summary would be: that the mean GPA of night students is different from the mean GPA of day students.arrow_forwardA quiz related to digital knowledge was conducted. The quiz had 10 questions and covered topics such as the purpose of browser cookies, phishing scams, and privacy policies. The survey was given to 50 people. The mean score is 4.1 with a standard deviation of 2.6. We want to know if the data provide evidence that the mean score in the population is lower than 5. We will use alpha = 0.05 to make our decision. part a. Is this a one-sided or two-sided test? part b. What is the standard error for this problem? part c. How many degrees of freedom do we have for this problem? part d. What is the test statistic, t, for this problem? Based on your test statistic and degrees of freedom, the p-value will be between what two values? (If you cannot find the exact df in the table, round down to be safe. So if you have 38 df, round down to 30df.) Group of answer choices The p-value is between .1 and .05 The p-value is between .05 and .025 The p-value is between .025 and .01 The p-value…arrow_forwardA study on the latest fad diet claimed that the amounts of weight lost by all people on this diet had a mean of 20.3 pounds and a standard deviation of 3.7 pounds. Step 1 of 2: If a sampling distribution is created using samples of the amounts of weight lost by 94 people on this diet, what would be the mean of the sampling distribution of sample means? Round to two decimal places, if necessary. Answer Tables Keypad Keyboard Shortcutsarrow_forward
- Consider the data from the Anthropology 105 class. The mean for women is 64.33 in and the standard deviation is 2.64 in. The average height of men in the US is approximately 5ft 10in. What proportion of women represented here are shorter than the average man?arrow_forwardYou are testing the claim that the mean GPA of night students is different from the mean GPA of day students. You sample 20 night students, and the sample mean GPA is 2.94 with a standard deviation of 0.8. You sample 55 day students, and the sample mean GPA is 2.56 with a standard deviation of 0.44. Test the claim using a 1% level of significance. Assume the population standard deviations are unequal and that GPAs are normally distributed. What are the correct hypotheses? Based on the hypotheses, find the following:Test Statistic = Critical Values = ±arrow_forwardYou are testing the claim that the mean GPA of night students is different from the mean GPA of day students. You sample 35 night students, and the sample mean GPA is 2.91 with a standard deviation of 0.97. You sample 20 day students, and the sample mean GPA is 2.99 with a standard deviation of 0.82. Test the claim using a 1% level of significance. Assume the population standard deviations are unequal and that GPAS are normally distributed. Give answer to at least 4 decimal places. What are the correct hypotheses? Ho: M₁ H₁: M₁ Test Statistic = Critical Values = = ± H₁₂ Based on the hypotheses, find the following: ≠v H₂ OF (Just enter the positive CV.) The correct decision is to Fail to reject the null hypothesis The correct summary would be: There is not enough evidence to support the claim ✓ of night students is different from the mean GPA of day students. o that the mean GPAarrow_forward
- You are testing the claim that the mean GPA of night students is different from the mean GPA of day students. You sample 30 night students, and the sample mean GPA is 2.83 with a standard deviation of 0.94. You sample 55 day students, and the sample mean GPA is 2.97 with a standard deviation of 0.92. Test the claim using a 1% level of significance. Assume the population standard deviations are unequal and that GPAs are normally distributed. Give answer to at least 4 decimal places. What are the correct hypotheses?H0: Select an answer μ σ² μ₂ p μ₁ x̄₂ s² x̄₁ = Select an answer μ x̄₂ σ² μ₂ x̄₁ μ₁ s² p H1: Select an answer σ² μ x̄₁ s² p x̄₂ μ₁ μ₂ ? = < > ≤ ≠ ≥ Select an answer μ x̄₂ x̄₁ μ₂ σ² s² μ₁ p Based on the hypotheses, find the following:Test Statistic = Critical Values = ±± (Just enter the positive CV.)The correct decision is to Select an answer Reject the null hypothesis Fail to reject the null hypothesis The correct summary would be: Select an answer There is not enough…arrow_forwardGiven two dependent random samples with the following results: Population 1 48 29 32 29 38 31 28 Population 2 45 38 41 16 40 28 38 Use this data to find the 95% confidence interval for the true difference between the population means. Assume that both populations are normally distributed. Copy Data Step 2 of 4 : Calculate the sample standard deviation of the paired differences. Round your answer to six decimal places.arrow_forwardConsider the following data: −10, −10, 0, 3, −10, 3, 3 Step 1 of 3: Calculate the value of the sample Variance. Round your answer to one decimal place. Step 2 of 3: Calculate the value of the sample deviation. Round your answer to one decimal place. Step 3 of 3: Calculate the value of the range.arrow_forward
- 9 The standard error of the mean is, a 0.881 b 0.735 c 0.612 d 0.510arrow_forwardYou would like to construct a 95% confidence interval to estimate the population mean score on a nationwide examination in psychology, and for this purpose we choose a random sample of exam scores. The sample we choose has a mean of 511 and a standard deviation of 71. (a) What is the best point estimate, based on the sample, to use for the population mean? X ? (b) For each of the following sampling scenarios, determine which distribution should be used to calculate the critical value for the 95% confidence interval for the population mean. (In the table, Z refers to a standard normal distribution, and t refers to a t distribution.)arrow_forwardPrincipal Jones collects data on how students in her school performed on a standardized test in math. If the population standard deviation is not known, the appropriate test for Principal Jones to use is: Question 5 options: z test Independent samples t test Single sample t test Correlationarrow_forward
arrow_back_ios
arrow_forward_ios
Recommended textbooks for you
- MATLAB: An Introduction with ApplicationsStatisticsISBN:9781119256830Author:Amos GilatPublisher:John Wiley & Sons Inc
 Probability and Statistics for Engineering and th...StatisticsISBN:9781305251809Author:Jay L. DevorePublisher:Cengage Learning
 Statistics for The Behavioral Sciences (MindTap C...StatisticsISBN:9781305504912Author:Frederick J Gravetter, Larry B. WallnauPublisher:Cengage Learning
  Elementary Statistics: Picturing the World (7th E...StatisticsISBN:9780134683416Author:Ron Larson, Betsy FarberPublisher:PEARSON
 The Basic Practice of StatisticsStatisticsISBN:9781319042578Author:David S. Moore, William I. Notz, Michael A. FlignerPublisher:W. H. Freeman
 Introduction to the Practice of StatisticsStatisticsISBN:9781319013387Author:David S. Moore, George P. McCabe, Bruce A. CraigPublisher:W. H. Freeman
MATLAB: An Introduction with Applications
Statistics
ISBN:9781119256830
Author:Amos Gilat
Publisher:John Wiley & Sons Inc
Probability and Statistics for Engineering and th...
Statistics
ISBN:9781305251809
Author:Jay L. Devore
Publisher:Cengage Learning
Statistics for The Behavioral Sciences (MindTap C...
Statistics
ISBN:9781305504912
Author:Frederick J Gravetter, Larry B. Wallnau
Publisher:Cengage Learning
Elementary Statistics: Picturing the World (7th E...
Statistics
ISBN:9780134683416
Author:Ron Larson, Betsy Farber
Publisher:PEARSON
The Basic Practice of Statistics
Statistics
ISBN:9781319042578
Author:David S. Moore, William I. Notz, Michael A. Fligner
Publisher:W. H. Freeman
Introduction to the Practice of Statistics
Statistics
ISBN:9781319013387
Author:David S. Moore, George P. McCabe, Bruce A. Craig
Publisher:W. H. Freeman