MATLAB: An Introduction with Applications
6th Edition
ISBN: 9781119256830
Author: Amos Gilat
Publisher: John Wiley & Sons Inc
expand_more
expand_more
format_list_bulleted
Question
We have studied 2 different test statistics, z, and X2. Explain the similarities in;
- How each test statistic is calculated
- How each test statistic is used to determine if the sample statistic provides enough evidence against the null hypothesis to reject it.
*i saw another answer on here but it didn't go in depth so im still confused
Expert Solution
arrow_forward
Step 1
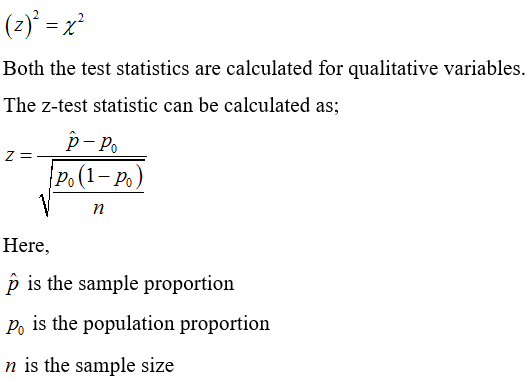
1.The z-test statistic for independent proportions and the chi-square test statistic are related to each other in such a way that the square of the z-test statistic is equal to the chi-square test statistic. That is,

arrow_forward
Step 2
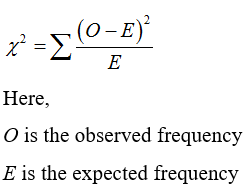
The chi-square test statistic is,

The chi-square test statistic is derived using the z-test statistic for proportion.
Step by stepSolved in 3 steps with 3 images

Knowledge Booster
Learn more about
Need a deep-dive on the concept behind this application? Look no further. Learn more about this topic, statistics and related others by exploring similar questions and additional content below.Similar questions
- what is the indepedent variable and dependent variable in this question " Why does Los Angeles County have more Covid 19 cases then Kern County"?arrow_forwardplease answer part b Also is there significant evidence that brand 1 and 3 different in mean ratings? is there significant evidence that brand 1 and 4 different in mean ratings? is there significant evidence that brand 2 and 3 different in mean ratings? is there significant evidence that brand 2 and 4 different in mean ratings? is there significant evidence that brand 3 and 4 different in mean ratings?arrow_forwardFor the following questions, THERE IS NO NEED FOR EXPLANATION. PLEASE PROVIDE JUST THE ANSWER THANK YOU. Please DO NOT waste time on writing things to explain. Please answer in 30 mintues or else I will write a bad review. If you follow my rules and answer in less than 30 mintues then I will write a very long and wonderful review about you. ANSWER the questions correlty and please answer all the questions with what it regards in saying exactly.arrow_forward
- The results of a common standardized test used in psychology research is designed so that the population mean is 105 and the standard devlation is 30. A subject earns a score of 108. What is the Z-score for this raw score? Z-Score =arrow_forwardLogan and Brian began arguing about who did better on their tests, but they couldn't decide who did better given that they took different tests. Logan took a test in Art History and earned a 76.8, and Brian took a test in English and earned a 68.9. Use the fact that all the students' test grades in the Art History class had a mean of 71.9 and a standard deviation of 11.6, and all the students' test grades in English had a mean of 61 and a standard deviation of 9.4 to answer the following questions.a) Calculate the z-score for Logan's test grade.z=z= [Round your answer to two decimal places.] b) Calculate the z-score for Brian's test grade.z=z= [Round your answer to two decimal places.]c) Which person did relatively better? Logan Brian They did equally well.arrow_forwardDoes reading the Harry Potter books encourage tolerance? It depends. Italian fifth graders were (randomly) split into two groups. Half the students met with researchers and discussed passages from the Harry Potter books that handled prejudice, while the others talked about unrelated sections. *Data are fabricated but match actual results When determining whether or not the main effects and interactions were significant, for the sake of this assignment, let’s say that the difference between the calculated means/differences must be .7 or higher to be significant. Posttest attitudes toward immigration (7-pt scale) Discussed prejudice-related sections Discussed unrelated sections High identification w/ Harry 6.2 5.0 Low identification w/ Harry 4.2 4.4 Is there a main effect of identification? (calculate marginal means). Is there a main effect of section? (calculate marginal means). Is there an interaction effect? (calculate “difference of differences”)…arrow_forward
- Explain the difference between a one-tailed and two-tailed significance test. When is it appropriate to use each test?arrow_forwardWhy are post hoc tests performed?arrow_forwardDescribe a study in which you can use both nonparametric and parametric statistics. A researcher has participants expecting to receive either painful or mild electrical shocks during a study wait in a quarter-full waiting room with other participants. He then measures whether they choose to sit next to other participants or if they sit far away on their own. What is the best test to run for this study and why?arrow_forward
- The mean age of bus drivers in chicago is 56.7 years. If a hypothesis test is performed, how should you interpret a decision that rejects the null hypothesis?arrow_forwarduse the math problem uploaded to answer the question. Will you reject or fail to reject the null hypothesis? choose one: a) The P-Value is greater than the level of significance and so we reject the null hypothesis that the variances are equal. At 0.05 level of significance, we conclude that the variance for the first plot is greater than the variance for the second plot. b) The P-Value is greater than the level of significance and so we fail to reject the null hypothesis that the variances are equal. At 0.05 level of significance, we conclude that the variance for the first plot is equal to the variance for the second plot. c) The P-Value is greater than the level of significance and so we reject the null hypothesis that the variances are equal. At 0.05 level of significance, we conclude that the variance for the first plot is equal to the variance for the second plot. d) The P-Value is less than the level of significance and so we fail to reject the null hypothesis…arrow_forwardCan you please answer all of the questions in the picture please. Explain and show your work ON PICTURES PLEASE! IT'S EASY TO UNDERTAND.arrow_forward
arrow_back_ios
arrow_forward_ios
Recommended textbooks for you
 MATLAB: An Introduction with ApplicationsStatisticsISBN:9781119256830Author:Amos GilatPublisher:John Wiley & Sons Inc
 Probability and Statistics for Engineering and th...StatisticsISBN:9781305251809Author:Jay L. DevorePublisher:Cengage Learning
 Statistics for The Behavioral Sciences (MindTap C...StatisticsISBN:9781305504912Author:Frederick J Gravetter, Larry B. WallnauPublisher:Cengage Learning
 Elementary Statistics: Picturing the World (7th E...StatisticsISBN:9780134683416Author:Ron Larson, Betsy FarberPublisher:PEARSON
 The Basic Practice of StatisticsStatisticsISBN:9781319042578Author:David S. Moore, William I. Notz, Michael A. FlignerPublisher:W. H. Freeman
 Introduction to the Practice of StatisticsStatisticsISBN:9781319013387Author:David S. Moore, George P. McCabe, Bruce A. CraigPublisher:W. H. Freeman

MATLAB: An Introduction with Applications
Statistics
ISBN:9781119256830
Author:Amos Gilat
Publisher:John Wiley & Sons Inc

Probability and Statistics for Engineering and th...
Statistics
ISBN:9781305251809
Author:Jay L. Devore
Publisher:Cengage Learning

Statistics for The Behavioral Sciences (MindTap C...
Statistics
ISBN:9781305504912
Author:Frederick J Gravetter, Larry B. Wallnau
Publisher:Cengage Learning

Elementary Statistics: Picturing the World (7th E...
Statistics
ISBN:9780134683416
Author:Ron Larson, Betsy Farber
Publisher:PEARSON

The Basic Practice of Statistics
Statistics
ISBN:9781319042578
Author:David S. Moore, William I. Notz, Michael A. Fligner
Publisher:W. H. Freeman

Introduction to the Practice of Statistics
Statistics
ISBN:9781319013387
Author:David S. Moore, George P. McCabe, Bruce A. Craig
Publisher:W. H. Freeman