MATLAB: An Introduction with Applications
6th Edition
ISBN: 9781119256830
Author: Amos Gilat
Publisher: John Wiley & Sons Inc
expand_more
expand_more
format_list_bulleted
Question

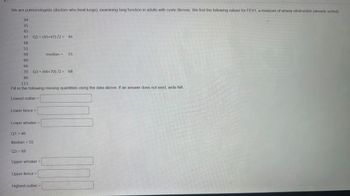
Transcribed Image Text:We are pulmonologists (doctors who treat lungs), examining lung function in adults with cystic fibrosis. We find the following values for FEV1, a measure of airway obstruction (already sorted).
34
35
45
48
51
59
60
66
70 Q3 = (66+70)/2 = 68
86
Q1 = (45+47)/2 = 46
113
Fill in the following missing quantities using the data above. If an answer does not exist, write NA
Lowest outlier =
Lower fence =
Lower whisker =
Q1 = 46
Median = 55
Q3 = 68
Upper whisker =
Upper fence =
median = 55
Highest outlier =
Expert Solution
This question has been solved!
Explore an expertly crafted, step-by-step solution for a thorough understanding of key concepts.
Step by stepSolved in 3 steps with 1 images

Knowledge Booster
Similar questions
- A researcher develops a test for identifying intellectually gifted children. It has a μ=56 and σ=8. a. what percentage of children are expected to score above 60? b. What percentage of the scores will be below 54? *ANSWER BOTH PARTS A & B*arrow_forwardA popular theory is that presidential candidates have an advantage if they are taller than their main opponents. Listed are heights (in centimeters) of randomly selected presidents along with the heights of their main opponents. Complete parts (a) and (b) below. Height (cm) of President 185 170 179 191 194 179 9 Height (cm) of Main Opponent 170 184 174 166 194 182 Identify the test statistic. t= 0.57 (Round to two decimal places as needed.) Identify the P-value P-value = 0.286 (Round to three decimal places as needed.) What is the conclusion based on the hypothesis test? Since the P-value is greater than the significance level, fail to reject the null hypothesis. There is not sufficient evidence to support the claim that presidents tend to be taller than their opponents. b. Construct the confidence interval that could be used for the hypothesis test described in part (a). What feature of the confidence interval leads to the same conclusion reached in part (a)? The confidence interval…arrow_forwardFor a population with ? = 100 and ? = 20, what is the X value corresponding to z = 1.50? 30115 101.5130arrow_forward
- cmid=855541&page=28 page n F5 Pat received the following grades in four classes. In Pat's History class, what is the percentage of students scoring higher than Pat? (round to two decimal places, don't include the % sign in your answer) % Subject Psychology Math History English Answer: F6 + W F7 Pat's Grade 75 90 86 83 W & F8 Class Mean 83 85 80 88 Pa F9 F10 Class Standard Deviation 8 6 4 A X F11 * F12 Home End Insert +1 Time left 1:35:4 Next page 12:54 PM *A*G 2/17/2023 Q T495S Delete Backspacearrow_forwardIn a study of exhaust emissions from school buses, the pollution intake by passengers was determined for a sample of nine school buses used in the Southern California Air Basin. The pollution intake is the amount of exhaust emissions, in grams per person, that would be inhaled while traveling on the bus during its usual 18-mile trip on congested freeways from South Central LA to a magnet school in West LA. Here are the amounts for the nine buses when driven with the windows open. 1.17 0.33 0.40 0.33 1.32 0.38 0.25 0.40 0.35 (a) Consider making a stemplot. Are there outliers or strong skewness that would preclude use of the t procedures? Which is correct? A. The sample is small and the stemplot is right skewed with possible outliers, so use of t procedures is not appropriate. b. The distribution is symmetric so use of t procedures is appropriate. c. The sample is small and the stemplot is left skewed with possible outliers, so use of t procedures is…arrow_forwardBeanie babies are toy stuffed animals that have become valuable collector’s items. Beanie World Magazine provided the age, retired status (R for Retired and C for Current), and value of 50 Beanie babies. The data Beanie can be downloaded from Blackboard. Answer the following questions using Minitab. a) Show the retired/current status of the 50 Beanie babies with pie chart and bar chart. b) What percentage of the age measurements actually fall into ¯x±s, ¯x±2s, and ¯x±3s. Compare your result with the empirical rulearrow_forward
arrow_back_ios
arrow_forward_ios
Recommended textbooks for you
 MATLAB: An Introduction with ApplicationsStatisticsISBN:9781119256830Author:Amos GilatPublisher:John Wiley & Sons Inc
 Probability and Statistics for Engineering and th...StatisticsISBN:9781305251809Author:Jay L. DevorePublisher:Cengage Learning
 Statistics for The Behavioral Sciences (MindTap C...StatisticsISBN:9781305504912Author:Frederick J Gravetter, Larry B. WallnauPublisher:Cengage Learning
 Elementary Statistics: Picturing the World (7th E...StatisticsISBN:9780134683416Author:Ron Larson, Betsy FarberPublisher:PEARSON
 The Basic Practice of StatisticsStatisticsISBN:9781319042578Author:David S. Moore, William I. Notz, Michael A. FlignerPublisher:W. H. Freeman
 Introduction to the Practice of StatisticsStatisticsISBN:9781319013387Author:David S. Moore, George P. McCabe, Bruce A. CraigPublisher:W. H. Freeman

MATLAB: An Introduction with Applications
Statistics
ISBN:9781119256830
Author:Amos Gilat
Publisher:John Wiley & Sons Inc

Probability and Statistics for Engineering and th...
Statistics
ISBN:9781305251809
Author:Jay L. Devore
Publisher:Cengage Learning

Statistics for The Behavioral Sciences (MindTap C...
Statistics
ISBN:9781305504912
Author:Frederick J Gravetter, Larry B. Wallnau
Publisher:Cengage Learning

Elementary Statistics: Picturing the World (7th E...
Statistics
ISBN:9780134683416
Author:Ron Larson, Betsy Farber
Publisher:PEARSON

The Basic Practice of Statistics
Statistics
ISBN:9781319042578
Author:David S. Moore, William I. Notz, Michael A. Fligner
Publisher:W. H. Freeman

Introduction to the Practice of Statistics
Statistics
ISBN:9781319013387
Author:David S. Moore, George P. McCabe, Bruce A. Craig
Publisher:W. H. Freeman