
MATLAB: An Introduction with Applications
6th Edition
ISBN: 9781119256830
Author: Amos Gilat
Publisher: John Wiley & Sons Inc
expand_more
expand_more
format_list_bulleted
Related questions
Question
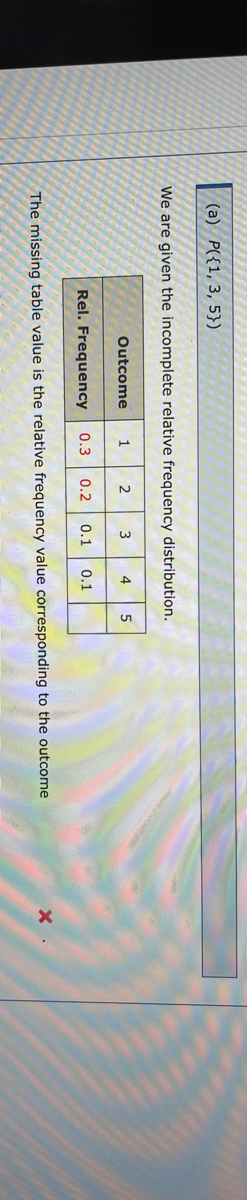

Transcribed Image Text:(а) Р({1, 3, 5})
We are given the incomplete relative frequency distribution.
Outcome
1
2
3
4
5
Rel. Frequency
0.3 0.2
0.1
0.1
The missing table value is the relative frequency value corresponding to the outcome
Expert Solution
This question has been solved!
Explore an expertly crafted, step-by-step solution for a thorough understanding of key concepts.

This is a popular solution

Trending nowThis is a popular solution!

Step by stepSolved in 2 steps

Knowledge Booster

Similar questions
- TIT Frequency 26 19 2. Tornado F-Scale he given data represents a frequency distribution of the F-scale intensities of recent tornadoes, Use the equency distribution to construct a frequency polygon. Does the graph suggest that the distribution is skewed? If 5o, how? Construct a frequency polygon using the data. Choose the correct graph below. OB. C. OD. O A. Frequency 30- Frequency 30 Frequency 30- Frequency 30- 0 -1 F-Scale -1 F-Scale F-Scale F-Scale Does the graph suggest that the distribution is skewed? If so, how? O A. The distribution appears to be skewed to both sides. O B. The distribution appears to be skewed to the right (or positively skewed). Click to select your answer. 3:40 PM a 4) 6/4/2021 耳 17 Type here to search hp ins f12 f1o prt sc f6 40 fg fg 144 AAA 米 I01 esc & $4 4 %23 3 5 7. 7 Y 00 R %24arrow_forward1.64 Hispanic population. The US census collects data on race and ethnicity of Americans, among many other variables. The histogram below shows the distribution of the percentage of the population that is Hispanic in 3,143 counties in the US in 2010. Also shown is a histogram of logs of these values. 2000- 1500- 1000- 500- O 20 40 60 Hispanic % 80 Math Statistics and Probability esc 100 (a) Describe the numerical distribution and comment on why we might want to use log-transformed values in analyzing or modeling these data. (b) What features of the distribution of the Hispanic population in US counties are apparent in the map but not in the histogram? What features are apparent in the histogram but not the map? (c) Is one visualization more appropriate or helpful than the other? Explain your reasoning. ! 1 (a) Describe the numerical distribution and comment on why we might want to use log-transformed values in analyzing or modeling these data. 250 200 150- 100- 50- 0 (b) What features…arrow_forwardPart A of this Question, In general what are the steps to finding the distribution of the Xbar?arrow_forward
- DO esc 2 1 Q Nine cyclists were each asked the distance in miles they biked last week. Their responses are given below. Complete the grouped frequency distribution for the data. In the distribution, the frequency of a class is the number of distances in that class. (Note that we are using a class width of 6.) A Y Penguin Portal | YSU O DESCRIPTIVE STATISTICS Constructing a frequency distribution for grouped data Distance in miles F1 18 18 12 O 11 19 9 Explanation 9.6 @ 2 15 F2 W S Check Distance in miles # 3 2 to 7 E 8 to 13 14 to 19 80 F3 D $ 4 Q F4 R Frequency U 0 U F % 5 LO 9 F5 T G X www-awu.aleks.com 6 F6 Content MacBook Air Y Ś & 7 H F7 © 2022 McGraw Hill LLC. All Rights Reserved. Te U * 8 J DII F8 9 C K F9 0arrow_forwardPART I. SAMPLING DISTRIBUTION OF THE MEAN Assume you have a population which has been measured on a scale of career ambition with u = 150 and o = 40. Assume that the ambition scores are normally distributed in the population. Assume that you have drawn a sample of 100 individuals from the population and have recorded the mean in this sample. Then you have replaced the individuals in the population and have drawn another sample of size 100. You keep doing this repeatedly until you have a list of the sample means in a huge number of samples from this population. Now you make a plot of the means of all the samples (i.e., you form a distribution of the sample means). 1. What is this distribution called? 2. What is the numerical value of the mean of the distribution you have created? 3. In general, how does the mean of the distribution you have created relate to the population mean? 4. What will be the shape of the distribution of means? Explain your answer. 5. Now suppose you calculate the…arrow_forwardble scored 0,4, rcle) People D 2 5 3 O b. On a measure of social anxiety people scored: 35, 40, 45, 40, 40, 35, 45, 50, 50, 60, 60, 70, 70, 30, 40, 45, 50, 40, 40, 30 Qualitative or Quantitative? Graph of this distribution: c. Survey partic religious beliefs Atheist (A), Agr GCFCGACG Qualitative or C Religines benef Christia Atheist Agnostic Fooche Graph of this distarrow_forward
- Favorite Coffee Flavor A survey was taken asking the favorite flavor of a coffee drink a person prefers. The responses were C=Caramel, H=Hazelnut, M= Mocha, P= Plain, and V=Vanilla. с н C V V H H H P V M H V P P V C P M P P Send data to Excel Part: 0 / 2 Part 1 of 2 Construct a categorical frequency distribution for the data. Class Frequency Caramel Hazelnut Mocha Plainarrow_forwardThe mean is less than the median. This histogram is negatively-skewed. O The mean is less than the median. This histogram is positively-skewed. O The median is less than the mean. This histogram is negatively-skewed. QUESTION 13 The distributions of income in the United States is strongly skewed to the right. Which of the following is true? O The median income is smaller than the mean income. O The median income is larger than the mean income. O The median income is equal to the mean income. O There is not enough information to compare the median and mean values. QUESTION 14 Click Save and Submit to save and submit. Click Save All Answers to save all answers. Worksheet Py....docx Reading - Ma W MLK Letter -2.pdf Worksheet - W....docx W Anom doon MOS nI DIC. étv 11arrow_forward
arrow_back_ios
arrow_forward_ios
Recommended textbooks for you
- MATLAB: An Introduction with ApplicationsStatisticsISBN:9781119256830Author:Amos GilatPublisher:John Wiley & Sons Inc
 Probability and Statistics for Engineering and th...StatisticsISBN:9781305251809Author:Jay L. DevorePublisher:Cengage Learning
 Statistics for The Behavioral Sciences (MindTap C...StatisticsISBN:9781305504912Author:Frederick J Gravetter, Larry B. WallnauPublisher:Cengage Learning
  Elementary Statistics: Picturing the World (7th E...StatisticsISBN:9780134683416Author:Ron Larson, Betsy FarberPublisher:PEARSON
 The Basic Practice of StatisticsStatisticsISBN:9781319042578Author:David S. Moore, William I. Notz, Michael A. FlignerPublisher:W. H. Freeman
 Introduction to the Practice of StatisticsStatisticsISBN:9781319013387Author:David S. Moore, George P. McCabe, Bruce A. CraigPublisher:W. H. Freeman
MATLAB: An Introduction with Applications
Statistics
ISBN:9781119256830
Author:Amos Gilat
Publisher:John Wiley & Sons Inc
Probability and Statistics for Engineering and th...
Statistics
ISBN:9781305251809
Author:Jay L. Devore
Publisher:Cengage Learning
Statistics for The Behavioral Sciences (MindTap C...
Statistics
ISBN:9781305504912
Author:Frederick J Gravetter, Larry B. Wallnau
Publisher:Cengage Learning
Elementary Statistics: Picturing the World (7th E...
Statistics
ISBN:9780134683416
Author:Ron Larson, Betsy Farber
Publisher:PEARSON
The Basic Practice of Statistics
Statistics
ISBN:9781319042578
Author:David S. Moore, William I. Notz, Michael A. Fligner
Publisher:W. H. Freeman
Introduction to the Practice of Statistics
Statistics
ISBN:9781319013387
Author:David S. Moore, George P. McCabe, Bruce A. Craig
Publisher:W. H. Freeman