
MATLAB: An Introduction with Applications
6th Edition
ISBN: 9781119256830
Author: Amos Gilat
Publisher: John Wiley & Sons Inc
expand_more
expand_more
format_list_bulleted
Related questions
Concept explainers
Question
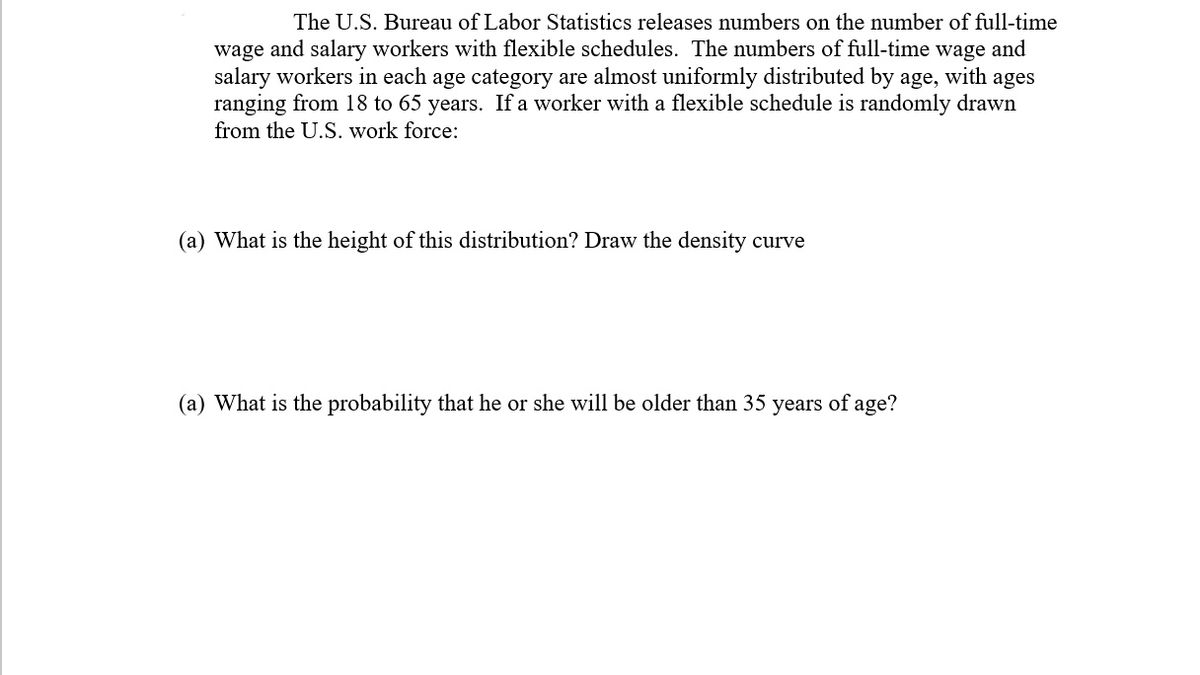

Transcribed Image Text:The U.S. Bureau of Labor Statistics releases numbers on the number of full-time
wage and salary workers with flexible schedules. The numbers of full-time wage and
salary workers in each age category are almost uniformly distributed by age, with ages
ranging from 18 to 65 years. If a worker with a flexible schedule is randomly drawn
from the U.S. work force:
(a) What is the height of this distribution? Draw the density curve
(a) What is the probability that he or she will be older than 35 years of age?
Expert Solution
This question has been solved!
Explore an expertly crafted, step-by-step solution for a thorough understanding of key concepts.

This is a popular solution

Trending nowThis is a popular solution!

Step by stepSolved in 2 steps with 2 images

Knowledge Booster


Learn more about
Need a deep-dive on the concept behind this application? Look no further. Learn more about this topic, statistics and related others by exploring similar questions and additional content below.Similar questions
- An amusement park keeps track of the percentage of individuals with season passes according to age category. An independent tourist company would like to show that this distribution of age category for individuals buying season passes is different from what the amusement park claims. The tourist company randomly sampled 200 individuals entering the park with a season pass and recorded the number of individuals within each age category. Age Category Child (under 13 years old) Teen (13 to 19 years old) Adult (20 to 55 years old) Senior (56 years old and over) Number of Individuals 56 86 44 14 The tourist company will use the data to test the amusement park’s claim, which is reflected in the following null hypothesis. H0:pchild=0.23H0:pchild=0.23, pteen=0.45pteen=0.45, padult=0.20padult=0.20, and psenior=0.12psenior=0.12. What inference procedure will the company use to investigate whether or not the distribution of age category for individuals with season passes is…arrow_forwardHere are four pairs of normal distributions. In each pair the right one (blue) represents one group and the left one (red) represents another group. Which pair represents the largest "effect size"; that is, which one has the largest Cohen's d score? O The top one The second one down The third one The bottom onearrow_forwardA study examined how long aircraft air conditioning units operated after being repaired. Here are the operating times (in hours) for one unit: 97 51 11 4 141 18 142 68 77 80 1 16 106 206 82 54 31 216 46 111 39 63 18 191 18 163 24 (a) Make a histogram, using classes that are 40 hours wide, beginning with: 0 time 40, 40 time 80, . . . (b) Describe the overall shape of the distribution: Is it roughly symmetric, skewed to the right, or skewed to the left? Are there any outliers? (c) Is the five-number summary or the mean and standard deviation a better brief summary for this distribution? Explain your choice. Calculate the one of these summaries that you choose.arrow_forward
- Use the three distributions labeled i,ii,iii to answer the following questions (shown in picture upload)arrow_forwardGiven the following data for an imaginary superhero universe: Flying Telepathy Super Strength Female 19 88 90 Male 96 33 68 Distribution of Super Power by Gender What is the empirical probability that a randomly selected superhero will have telepathy? Answer in decimal form. Round to 3 decimal places as neededarrow_forwardAccording to Benford's Law, a variety of different data sets include numbers with leading (first) digits that follow the distribution shown in the table below. Test forgoodness-of-fit with Benford's Law. Leading Digit 1 2 3 4 5 6 7 8 9 Benford's law: distribution of leading digits 30.1% 17.6% 12.5% 9.7% 7.9% 6.7% 5.8% 5.1% 4.6% When working for the Brooklyn District Attorney, investigator Robert Burton analyzed the leading digits of the amounts from 784 checks issued by seven suspect companies. The frequencies were found to be 0, 12, 0, 73, 482, 186, 8, 23, and 0, and those digits correspond to the leading digits of 1, 2, 3, 4, 5, 6, 7, 8, and 9, respectively. If the observed frequencies are substantially different from the frequencies expected with Benford's Law, the check amounts appear to result from fraud. Use a 0.05 significance level to test for goodness-of-fit with Benford's Law. What is the value…arrow_forward
- Given the following data for an imaginary superhero universe: Flying Telepathy Super Strength Female 91 15 97 Male 44 74 80 Distribution of Super Power by Gender What is the empirical probability that a randomly selected superhero will have super strength? Answer in decimal form. Round to 3 decimal places as needed Your Answer: Answerarrow_forwardHospital visits: According to a health agency, there were 409,689 hosital visits for asthma-related illnesses in a recent year. The age distribution was as follows. Round your answers to four decimal places if necessary. Age Range Less than 1 year 1-17 18-44 45-64 65-84 85 and up Total Send data to Excel Part 1 of 3 (a) What is the probability that an asthma patient is between 18 and 44 years old? The probability that an asthma patient is between 18 and 44 years old is 0.1944 Part 2 of 3 (b) What is the probability than an asthma patient is less than 1 year old? The probability that an asthma patient is less than 1 year old is 0.0192 Part: 2/3 Number 7862 103,032 79,653 121,731 80,658 16,753 409,689 Part 3 of 3 (c) Using a cutoff of 0.05, is it unusual for an asthma patient to be 85 years old or older? Based on a cutoff of 0.05, it (Choose one) unusual for an asthma patient to be 85 years old or older. is is not Xarrow_forwardThe marital status distribution of the U.S male population, age 15 and older, is as shown below in first column. Suppose that a random sample of 400 U.Syound adult males, 18-38 years old, yielded the following frequency distribution . We are interested in whether this age group of males fits the distribution of the U.S adult population. marital status expected frequency observed frequency never marreid 31.3 140 marreid 56.1 238 widowed 2.5 2 divorced/seperated 10.1 20 total 100 400 Choose the correct calculationarrow_forward
arrow_back_ios
arrow_forward_ios
Recommended textbooks for you
- MATLAB: An Introduction with ApplicationsStatisticsISBN:9781119256830Author:Amos GilatPublisher:John Wiley & Sons Inc
 Probability and Statistics for Engineering and th...StatisticsISBN:9781305251809Author:Jay L. DevorePublisher:Cengage Learning
 Statistics for The Behavioral Sciences (MindTap C...StatisticsISBN:9781305504912Author:Frederick J Gravetter, Larry B. WallnauPublisher:Cengage Learning
  Elementary Statistics: Picturing the World (7th E...StatisticsISBN:9780134683416Author:Ron Larson, Betsy FarberPublisher:PEARSON
 The Basic Practice of StatisticsStatisticsISBN:9781319042578Author:David S. Moore, William I. Notz, Michael A. FlignerPublisher:W. H. Freeman
 Introduction to the Practice of StatisticsStatisticsISBN:9781319013387Author:David S. Moore, George P. McCabe, Bruce A. CraigPublisher:W. H. Freeman
MATLAB: An Introduction with Applications
Statistics
ISBN:9781119256830
Author:Amos Gilat
Publisher:John Wiley & Sons Inc
Probability and Statistics for Engineering and th...
Statistics
ISBN:9781305251809
Author:Jay L. Devore
Publisher:Cengage Learning
Statistics for The Behavioral Sciences (MindTap C...
Statistics
ISBN:9781305504912
Author:Frederick J Gravetter, Larry B. Wallnau
Publisher:Cengage Learning
Elementary Statistics: Picturing the World (7th E...
Statistics
ISBN:9780134683416
Author:Ron Larson, Betsy Farber
Publisher:PEARSON
The Basic Practice of Statistics
Statistics
ISBN:9781319042578
Author:David S. Moore, William I. Notz, Michael A. Fligner
Publisher:W. H. Freeman
Introduction to the Practice of Statistics
Statistics
ISBN:9781319013387
Author:David S. Moore, George P. McCabe, Bruce A. Craig
Publisher:W. H. Freeman