
MATLAB: An Introduction with Applications
6th Edition
ISBN: 9781119256830
Author: Amos Gilat
Publisher: John Wiley & Sons Inc
expand_more
expand_more
format_list_bulleted
Related questions
Question
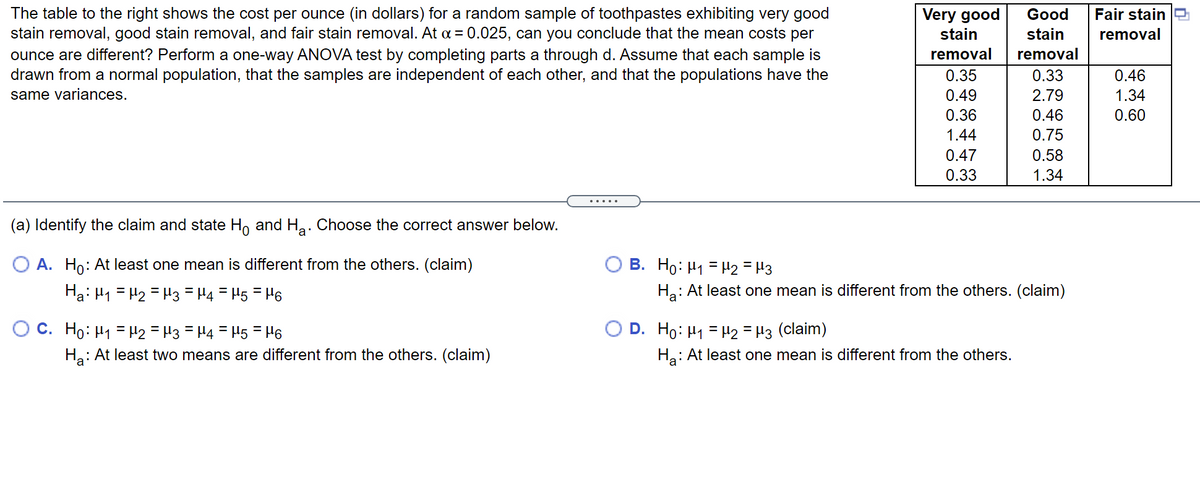

Transcribed Image Text:The table to the right shows the cost per ounce (in dollars) for a random sample of toothpastes exhibiting very good
stain removal, good stain removal, and fair stain removal. At a = 0.025, can you conclude that the mean costs per
ounce are different? Perform a one-way ANOVA test by completing parts a through d. Assume that each sample is
drawn from a normal population, that the samples are independent of each other, and that the populations have the
Very good
Good
Fair stain
stain
stain
removal
removal
removal
0.35
0.33
0.46
same variances.
0.49
2.79
1.34
0.36
0.46
0.60
1.44
0.75
0.47
0.58
0.33
1.34
(a) Identify the claim and state H, and Ha. Choose the correct answer below.
O A. Ho: At least one mean is different from the others. (claim)
B. Ho: H1 = H2 = H3
Ha: H1 = H2 = H3 = H4 = H5 = H6
Ha: At least one mean is different from the others. (claim)
O C. Ho: H1 = H2 = H3 = H4 = H5 = H6
D. Ho: H1 = H2 = H3 (claim)
Ha: At least one mean is different from the others.
Ha: At least two means are different from the others. (claim)
Expert Solution
This question has been solved!
Explore an expertly crafted, step-by-step solution for a thorough understanding of key concepts.

This is a popular solution

Trending nowThis is a popular solution!

Step by stepSolved in 2 steps

Knowledge Booster

Similar questions
- Golden Torch Cacti Lengths. Another variable Feldman and Crosswhite investigated in their study of Golden Torch cacti was total length of cuttings at the end of 16 months. Here are the data, in millimeters. We performed a two-way ANOVA on the data.arrow_forwardUse a standard normal table and find the area that lies to the left of 1.13.arrow_forwardFind a z-score such that 56% of the area under the standard normal curve is below that score. Z= Click the icon to view the area under the standard normal curve table. (Round to the nearest hundredth as needed.)arrow_forward
- Determine the area under the standard normal curve that lies between (a) Z= - 2.01 and Z= 2.01, (b) Z = - 0.36 and Z = 0, and (c) Z= - 2.02 and Z= 0.36. Click the icon to view a table of areas under the normal curve. ... (a) The area that lies between Z= - 2.01 and Z= 2.01 is (Round to four decimal places as needed.) (b) The area that lies between Z= - 0.36 and Z=0 is (Round to four decimal places as needed.) (c) The area that lies between Z = - 2.02 and Z = 0.36 is (Round to four decimal places as needed.)arrow_forwardExactly 50% of the area under the normal curve lies to the right of the mean. tRUE OR FLASE?arrow_forwardFind the area under the normal distribution curve between Z= 0.65 and Z= 2.30.arrow_forward
- Use the standard normal table to find the z-score that corresponds to the cumulative area 0.0150. If the area is not in the table, use the entry closest to the area. If the area is halfway between two entries, use the z-score halfway between the corresponding z-scores. Click to view page 1 of the standard normal table. Click to view page 2 of the standard normal table. (Type an integer or decimal rounded to three decimal places as needed.) Enter your answer in the answer box.arrow_forwardA hotel manager is reviewing the number of rented rooms per day. On a certain day, the z-score is 1.49 Find the area to the right of the z-score 1.49 under the standard normal curve. z1.21.31.40.000.88490.90320.91920.010.88690.90490.92070.020.88880.90660.92220.030.89070.90820.92360.040.89250.90990.92510.050.89440.91150.92650.060.89620.91310.92790.070.89800.91470.92920.080.89970.91620.93060.090.90150.91770.9319 Use the value(s) from the table above. Provide your answer below:arrow_forwardFind the area of the following z-scores using the z-table and draw the corresponding area under the standard normal curve on the space provided.arrow_forward
- Use the standard normal table to find the z-score that corresponds to the cumulative area 0.9848. If the area is not in the table, use the entry closest to the area. If the area is halfway between two entries, use the z-score halfway between the corresponding z-scores.arrow_forwardFind the area to the right of the z-score 0.03 under the standard normal curve. z−0.2−0.10.00.10.000.42070.46020.50000.53980.010.41680.45620.50400.54380.020.41290.45220.50800.54780.030.40900.44830.51200.55170.040.40520.44430.51600.55570.050.40130.44040.51990.55960.060.39740.43640.52390.56360.070.39360.43250.52790.56750.080.38970.42860.53190.57140.090.38590.42470.53590.5753 Use the value(s) from the table above. Provide your answer below: FEEDBACK Content attribution- Opens a dialogarrow_forwardIn a standard normal curve, what is the area between z = 0.27 and z = 2.03? O a. 37.24% O b. 47.88% O c. 10.64% O d. 58.52%arrow_forward
arrow_back_ios
SEE MORE QUESTIONS
arrow_forward_ios
Recommended textbooks for you
- MATLAB: An Introduction with ApplicationsStatisticsISBN:9781119256830Author:Amos GilatPublisher:John Wiley & Sons Inc
 Probability and Statistics for Engineering and th...StatisticsISBN:9781305251809Author:Jay L. DevorePublisher:Cengage Learning
 Statistics for The Behavioral Sciences (MindTap C...StatisticsISBN:9781305504912Author:Frederick J Gravetter, Larry B. WallnauPublisher:Cengage Learning
  Elementary Statistics: Picturing the World (7th E...StatisticsISBN:9780134683416Author:Ron Larson, Betsy FarberPublisher:PEARSON
 The Basic Practice of StatisticsStatisticsISBN:9781319042578Author:David S. Moore, William I. Notz, Michael A. FlignerPublisher:W. H. Freeman
 Introduction to the Practice of StatisticsStatisticsISBN:9781319013387Author:David S. Moore, George P. McCabe, Bruce A. CraigPublisher:W. H. Freeman
MATLAB: An Introduction with Applications
Statistics
ISBN:9781119256830
Author:Amos Gilat
Publisher:John Wiley & Sons Inc
Probability and Statistics for Engineering and th...
Statistics
ISBN:9781305251809
Author:Jay L. Devore
Publisher:Cengage Learning
Statistics for The Behavioral Sciences (MindTap C...
Statistics
ISBN:9781305504912
Author:Frederick J Gravetter, Larry B. Wallnau
Publisher:Cengage Learning
Elementary Statistics: Picturing the World (7th E...
Statistics
ISBN:9780134683416
Author:Ron Larson, Betsy Farber
Publisher:PEARSON
The Basic Practice of Statistics
Statistics
ISBN:9781319042578
Author:David S. Moore, William I. Notz, Michael A. Fligner
Publisher:W. H. Freeman
Introduction to the Practice of Statistics
Statistics
ISBN:9781319013387
Author:David S. Moore, George P. McCabe, Bruce A. Craig
Publisher:W. H. Freeman