
MATLAB: An Introduction with Applications
6th Edition
ISBN: 9781119256830
Author: Amos Gilat
Publisher: John Wiley & Sons Inc
expand_more
expand_more
format_list_bulleted
Related questions
Concept explainers
Question
A lecturer at WIN wanted to know if he can predict student’s quiz results by asking them to
complete a simple survey. The result of the survey is found in the file: Assignment 2 sem22020
data set 1.
| Quiz Results | EQR | Study Hrs | Age | Sex | BBT | MB | MC | AuHS | LM |
| 15 | 10 | 3 | 19 | 0 | 0 | 1 | 1 | 0 | 1 |
| 14 | 15 | 4 | 24 | 0 | 0 | 1 | 0 | 0 | 1 |
| 9 | 15 | 1 | 20 | 0 | 10 | 1 | 0 | 0 | 1 |
| 6 | 10 | 3 | 21 | 0 | 0 | 1 | 1 | 0 | 1 |
| 14 | 15 | 4 | 21 | 0 | 9 | 1 | 0 | 0 | 1 |
| 12 | 10 | 6 | 21 | 0 | 2 | 0 | 1 | 0 | 1 |
| 12 | 13 | 2 | 21 | 1 | 8 | 1 | 0 | 0 | 0 |
| 15 | 15 | 0 | 20 | 0 | 8 | 1 | 0 | 0 | 1 |
| 12 | 15 | 3 | 20 | 0 | 10 | 1 | 0 | 0 | 1 |
| 13 | 15 | 0.2 | 19 | 0 | 8 | 1 | 0 | 0 | 1 |
| 15 | 15 | 2 | 20 | 0 | 6 | 1 | 0 | 1 | 1 |
| 12 | 14 | 5 | 20 | 0 | 5 | 1 | 1 | 1 | 1 |
| 14 | 15 | 7 | 22 | 0 | 8 | 0 | 0 | 0 | 0 |
| 7 | 7 | 10 | 21 | 1 | 7 | 0 | 0 | 1 | 0 |
| 11 | 15 | 5 | 24 | 0 | 0 | 1 | 0 | 0 | 1 |
| 10 | 10 | 3 | 22 | 1 | 0 | 1 | 0 | 0 | 1 |
| 13 | 11 | 3 | 23 | 1 | 1 | 1 | 1 | 1 | 1 |
| 13 | 15 | 2 | 22 | 1 | 8 | 0 | 0 | 0 | 0 |
| 13 | 12 | 4 | 20 | 1 | 7 | 1 | 0 | 1 | 0 |
| 13 | 10 | 3 | 20 | 1 | 0 | 1 | 0 | 0 | 1 |
| 8 | 13 | 5 | 20 | 1 | 8 | 0 | 0 | 0 | 0 |
| 12 | 13 | 5 | 22 | 0 | 5 | 0 | 0 | 0 | 1 |
| 13 | 15 | 8 | 22 | 0 | 5 | 0 | 1 | 0 | 1 |
| 10 | 13 | 4 | 23 | 1 | 7 | 1 | 0 | 0 | 1 |
| 13 | 13 | 0.5 | 20 | 1 | 0 | 0 | 0 | 0 | 0 |
| 12 | 13 | 0.5 | 20 | 1 | 0 | 1 | 0 | 0 | 0 |
| 15 | 15 | 2 | 21 | 0 | 10 | 1 | 0 | 0 | 1 |
| 10 | 13 | 6 | 22 | 0 | 6 | 1 | 1 | 0 | 1 |
| 11 | 8 | 5 | 20 | 0 | 10 | 0 | 0 | 1 | 0 |
| 12 | 10 | 4 | 19 | 1 | 0 | 1 | 0 | 0 | 1 |
| 8 | 5 | 2 | 20 | 1 | 0 | 1 | 0 | 1 | 0 |
| 11 | 13 | 6 | 20 | 1 | 7.5 | 1 | 1 | 1 | 1 |
| 10 | 3 | 12 | 21 | 0 | 4 | 1 | 0 | 1 | 0 |
| 8 | 11 | 2 | 19 | 0 | 0 | 1 | 0 | 0 | 1 |
| 15 | 15 | 3 | 23 | 1 | 2 | 1 | 0 | 0 | 1 |
| 11 | 14 | 1 | 23 | 0 | 10 | 1 | 1 | 1 | 1 |
| 13 | 14 | 4 | 21 | 1 | 8 | 1 | 0 | 1 | 1 |
| 9 | 15 | 3 | 22 | 0 | 5 | 1 | 0 | 0 | 0 |
| 13 | 14 | 4 | 21 | 0 | 9 | 1 | 0 | 0 | 1 |
| 13 | 15 | 4 | 20 | 0 | 5 | 1 | 0 | 0 | 1 |
| 11 | 13 | 5 | 20 | 1 | 8 | 0 | 0 | 0 | 0 |
| 7 | 10 | 3 | 24 | 1 | 5 | 1 | 0 | 1 | 1 |
| 14 | 15 | 3 | 20 | 0 | 6 | 1 | 0 | 0 | 1 |
| 13 | 15 | 3 | 20 | 0 | 8 | 0 | 0 | 0 | 0 |
| 8 | 12 | 0.5 | 22 | 1 | 2 | 1 | 1 | 0 | 1 |
| 8 | 10 | 4 | 19 | 1 | 7 | 0 | 0 | 1 | 1 |
| 15 | 15 | 3 | 20 | 0 | 7 | 1 | 0 | 0 | 1 |
| 14 | 14 | 3 | 19 | 0 | 8 | 1 | 0 | 0 | 1 |
| 7 | 10 | 3 | 21 | 1 | 0 | 0 | 0 | 1 | 0 |
| 11 | 13 | 2 | 21 | 0 | 7 | 1 | 1 | 0 | 1 |
| 14 | 15 | 6 | 22 | 0 | 6 | 1 | 0 | 0 | 1 |
| 9 | 12 | 3 | 21 | 1 | 0 | 1 | 0 | 0 | 1 |
| 14 | 15 | 2 | 22 | 0 | 5 | 1 | 0 | 0 | 1 |
| 9 | 8 | 4 | 21 | 0 | 7 | 1 | 0 | 1 | 1 |
| 15 | 15 | 7 | 20 | 0 | 6 | 1 | 0 | 0 | 1 |
| 13 | 14 | 3 | 23 | 1 | 4 | 0 | 1 | 0 | 0 |
| 14 | 15 | 5 | 21 | 0 | 5 | 1 | 0 | 0 | 1 |
| 12 | 13 | 5 | 19 | 1 | 6 | 1 | 0 | 0 | 0 |
| 14 | 12 | 2 | 22 | 1 | 10 | 1 | 0 | 0 | 1 |
| 14 | 13 | 2 | 22 | 0 | 10 | 1 | 0 | 0 | 0 |
| 11 | 12 | 3 | 22 | 0 | 8 | 1 | 0 | 1 | 1 |
| 4 | 1 | 9 | 30 | 0 | 10 | 1 | 0 | 1 | 1 |
| 14 | 15 | 3 | 21 | 1 | 8 | 1 | 0 | 0 | 1 |
| 15 | 15 | 3 | 20 | 0 | 0 | 0 | 0 | 0 | 0 |
| 13 | 15 | 3 | 19 | 1 | 7 | 1 | 0 | 0 | 1 |
| 14 | 15 | 2 | 21 | 1 | 6 | 1 | 0 | 0 | 1 |
| 8 | 5 | 3 | 20 | 0 | 0 | 1 | 0 | 1 | 1 |
| 7 | 10 | 9 | 21 | 1 | 0 | 1 | 1 | 0 | 1 |
| 12 | 14 | 4 | 20 | 0 | 0 | 1 | 0 | 0 | 0 |
| 6 | 8 | 4 | 21 | 0 | 1 | 1 | 1 | 0 | 0 |
| 9 | 10 | 5 | 20 | 0 | 2 | 0 | 0 | 1 | 0 |
| 10 | 13 | 2 | 20 | 1 | 6 | 1 | 1 | 1 | 0 |
| 10 | 12 | 1 | 25 | 1 | 5 | 1 | 0 | 1 | 1 |
| 13 | 15 | 2 | 21 | 1 | 3 | 1 | 0 | 0 | 1 |
| 9 | 8 | 1 | 29 | 0 | 0 | 0 | 1 | 0 | 0 |
| 12 | 13 | 2 | 19 | 0 | 0 | 1 | 0 | 0 | 1 |
| 12 | 15 | 3 | 20 | 0 | 0 | 1 | 0 | 0 | 1 |
| 14 | 12 | 7 | 19 | 0 | 3 | 1 | 0 | 1 | 1 |
| 8 | 7 | 1 | 19 | 1 | 0 | 0 | 1 | 0 | 0 |
| 14 | 12 | 1 | 23 | 1 | 6 | 1 | 0 | 1 | 1 |
| 11 | 9 | 3 | 20 | 1 | 5 | 0 | 1 | 1 | 1 |
| 13 | 15 | 2 | 21 | 1 | 0 | 1 | 0 | 0 | 1 |
| 14 | 11 | 2 | 19 | 1 | 9 | 0 | 0 | 0 | 0 |
| 11 | 14 | 4 | 22 | 1 | 10 | 0 | 0 | 0 | 1 |
| 10 | 8 | 5 | 20 | 1 | 5 | 0 | 0 | 1 | 1 |
| 11 | 13 | 1 | 22 | 1 | 2 | 0 | 0 | 0 | 0 |
| 14 | 15 | 0.5 | 20 | 0 | 8 | 1 | 0 | 0 | 0 |
| 12 | 14 | 15 | 23 | 0 | 0 | 1 | 1 | 0 | 1 |
| 10 | 12 | 4 | 19 | 1 | 0 | 0 | 1 | 1 | 1 |
| 14 | 12 | 0 | 20 | 1 | 3 | 1 | 0 | 1 | 1 |
| 13 | 10 | 2 | 19 | 1 | 0 | 1 | 0 | 1 | 0 |
| 15 | 12 | 2 | 20 | 1 | 3 | 1 | 0 | 1 | 1 |
| 8 | 10 | 3 | 19 | 1 | 1 | 1 | 0 | 1 | 1 |
| 14 | 12 | 5 | 21 | 0 | 0 | 1 | 0 | 0 | 1 |
| 6 | 10 | 2 | 21 | 1 | 8 | 1 | 0 | 0 | 1 |
| 8 | 8 | 2 | 21 | 1 | 1 | 1 | 0 | 1 | 1 |
| 12 | 10 | 2 | 20 | 0 | 7 | 1 | 0 | 1 | 1 |
| 9 | 6 | 3 | 20 | 0 | 1 | 1 | 1 | 1 | 1 |
| 7 | 8 | 4 | 19 | 1 | 9 | 1 | 1 | 1 | 0 |
| 13 | 11 | 6 | 19 | 1 | 6 | 1 | 0 | 0 | 1 |
| 13 | 10 | 2 | 25 | 1 | 0 | 1 | 0 | 0 | 1 |
| 14 | 14 | 2 | 25 | 1 | 5 | 1 | 0 | 0 | 0 |
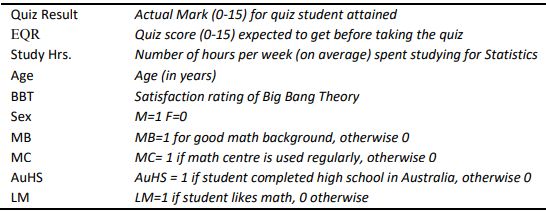
Variable List
(a) Using the variables listed in the table above, Describe each variable.
(b) State for each variable whether it is qualitative or quantitative; if it is qualitative, state
whether it is nominal or ordinal, and if it is quantitative, state whether it is discrete or
continuous.

Expert Solution
This question has been solved!
Explore an expertly crafted, step-by-step solution for a thorough understanding of key concepts.

This is a popular solution

Trending nowThis is a popular solution!

Step by stepSolved in 3 steps

Knowledge Booster


Learn more about
Need a deep-dive on the concept behind this application? Look no further. Learn more about this topic, statistics and related others by exploring similar questions and additional content below.Similar questions
- A toolset from the Uniform Crime Reporting (UCR) Program by the FBI allows the public to view summarized crime data at a state level. The user accessing the website can select between viewing the violent crime rate or the property crime rate. Choose the best description of the type of data collected in this selection. A. Ranked categorical B. Binary categorical C. Discrete quantitative D. Continuous quantitativearrow_forwardNonearrow_forwardPlease match each of the research studies below to the following : - Difference between means - Mean - Proportion - Difference in proportion - Mean of the differences A research study that examines the mean number of pounds loss in a weight loss clinic. A research study that compares the mean number of pounds loss between two different weight loss clinics. A research study that weighs individuals at the beginning of the weight loss program and measures the same individual at the end of the program and calculates the difference in weight for each individual. A research study that examines what percentage of individuals actually lost weight during the weight loss program. A research study that examines there is a difference in the percentage of individuals that have lost weight in clinic 1 versus in clinic 2.arrow_forward
- In order to determine if there was a relationship between living near power lines and a rare disease, what type of study design could be used? Edit View Insert Format Tools Tablearrow_forwardSomeone help please! It says I got partial credit for this frequency table but I reviewed it and I have no idea what is it I got wrong. Please double-check this for me. I think it's because of the zero on the proportion column, maybe I was supposed to put 0.00 instead of 0.0 or just 0. Please let me know thank you!arrow_forwardUse the same scales to construct boxplots for the pulse rates of males and females from the accompanying data sets. Use the boxplots to compare the two data sets. Click the icon to view the data sets. 40 50 60 70 80 90 100110 40 50 60 70 80 90 100110 OC. D. 40 50 60 70 80 90 100110 40 50 60 70 80 90 100110 Determine the boxplot for the women's boxplot data. A. В. 40 50 60 70 80 90 100110 40 50 60 70 80 90 100110 OC. OD. 40 50 60 70 80 90 100110 40 50 60 70 80 90 100110arrow_forward
- Using the given data, find the following. , 1.4, 5.9, 8.3, 15.2, 13.4, 11.8, 17.316.2 Identify the five-number summary. Round your answers to one decimal place as needed. Low =, Q1= MD= Q3= High=arrow_forwardCan you guys help me with this homework? Thank you!arrow_forwardFind the 5 number summary for the data shown x 3.9 5.4 6.5 8.9 11.3 11.8 24.6 27.8 28.4 5 number summary:3.9 ____, ______, ______, 28.4Use the Locator/Percentile method described in your book, not your calculatorarrow_forward
- Use the same scales to construct boxplots for the pulse rates of males and females from the accompanying data sets. Use the boxplots to compare the two data sets. Click the icon to view the data sets. Men's Pulse Rates 62 60 70 70 62 86 82 77 76 74 Full data set 87 53 90 65 69 56 80 61 76 80 53 60 67 63 62 49 70 60 70 56 64 77 67 60 69 73 73 62 50 57 Women's Pulse Rates 78 68 70 70 77 76 98 70 66 78 70 58 74 77 78 92 95 60 100 100 77 64 84 63 72 77 75 90 88 73 83 71 76 103 62 70 70 89 74 80 Choose the graphs that represent (picture attached!!) Compare the two boxplots. Choose the correct answer below. A. In general, it appears that males have higher pulse rates than females. The variation among the male pulse rates is much greater…arrow_forwardDefine Different Measure Scales?arrow_forwardHi, I need help with the rest of the parts for this exercise. Please complete as much as possible. ( It is completed all the way to 2C) Thanks in advance .arrow_forward
arrow_back_ios
SEE MORE QUESTIONS
arrow_forward_ios
Recommended textbooks for you
- MATLAB: An Introduction with ApplicationsStatisticsISBN:9781119256830Author:Amos GilatPublisher:John Wiley & Sons Inc
 Probability and Statistics for Engineering and th...StatisticsISBN:9781305251809Author:Jay L. DevorePublisher:Cengage Learning
 Statistics for The Behavioral Sciences (MindTap C...StatisticsISBN:9781305504912Author:Frederick J Gravetter, Larry B. WallnauPublisher:Cengage Learning
  Elementary Statistics: Picturing the World (7th E...StatisticsISBN:9780134683416Author:Ron Larson, Betsy FarberPublisher:PEARSON
 The Basic Practice of StatisticsStatisticsISBN:9781319042578Author:David S. Moore, William I. Notz, Michael A. FlignerPublisher:W. H. Freeman
 Introduction to the Practice of StatisticsStatisticsISBN:9781319013387Author:David S. Moore, George P. McCabe, Bruce A. CraigPublisher:W. H. Freeman
MATLAB: An Introduction with Applications
Statistics
ISBN:9781119256830
Author:Amos Gilat
Publisher:John Wiley & Sons Inc
Probability and Statistics for Engineering and th...
Statistics
ISBN:9781305251809
Author:Jay L. Devore
Publisher:Cengage Learning
Statistics for The Behavioral Sciences (MindTap C...
Statistics
ISBN:9781305504912
Author:Frederick J Gravetter, Larry B. Wallnau
Publisher:Cengage Learning
Elementary Statistics: Picturing the World (7th E...
Statistics
ISBN:9780134683416
Author:Ron Larson, Betsy Farber
Publisher:PEARSON
The Basic Practice of Statistics
Statistics
ISBN:9781319042578
Author:David S. Moore, William I. Notz, Michael A. Fligner
Publisher:W. H. Freeman
Introduction to the Practice of Statistics
Statistics
ISBN:9781319013387
Author:David S. Moore, George P. McCabe, Bruce A. Craig
Publisher:W. H. Freeman