
MATLAB: An Introduction with Applications
6th Edition
ISBN: 9781119256830
Author: Amos Gilat
Publisher: John Wiley & Sons Inc
expand_more
expand_more
format_list_bulleted
Related questions
Topic Video
Question

Transcribed Image Text:---
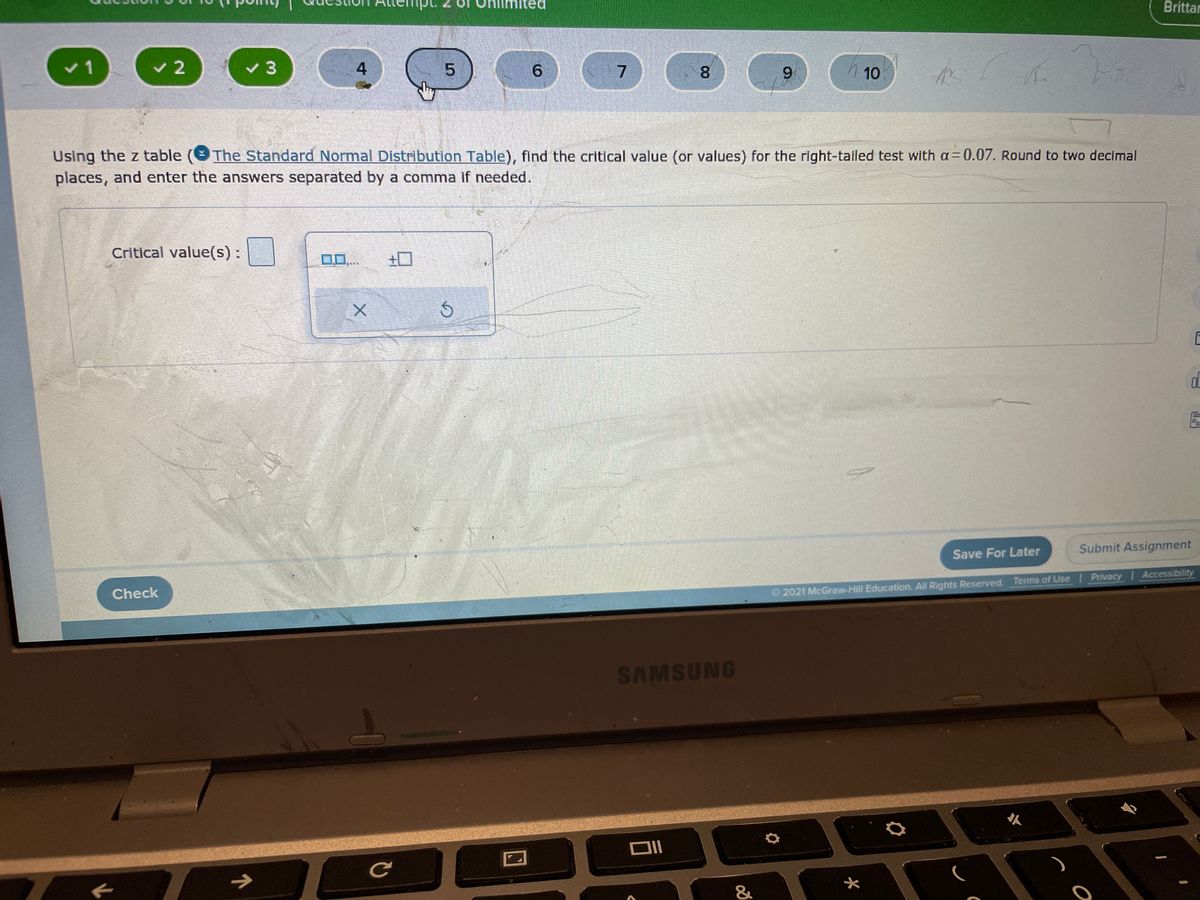
### Using the Z Table (The Standard Normal Distribution Table)
**Objective**: Find the critical value (or values) for the right-tailed test with \(\alpha = 0.07\). Round your answer to two decimal places and enter the values separated by a comma if needed.
#### Step-by-Step Instructions:
1. **Understand the Problem**:
- You are given a significance level (\(\alpha\)) of 0.07.
- This is a right-tailed test, which means you will find the critical value where the area to the right is \(\alpha\).
2. **Using the Z Table**:
- Refer to the Standard Normal Distribution Table to find the z-value that corresponds to an area of \(1 - \alpha = 0.93\).
3. **Calculate the Critical Value**:
- Locate the area closest to 0.93 in the z Table.
- Identify the z-value that corresponds to this area.
4. **Input the Answer**:
- Enter the critical value(s) in the box provided.
- Make sure to round to two decimal places.
#### Interactive Elements:
- **Critical Value(s) Box**:
- A box is present for entering your calculated critical value(s).
- There are additional options to add more values if the test requires multiple critical values.
- **Buttons**:
- **Check**: After entering your values, you can click this button to verify your answer.
- **Save For Later**: This option allows you to save your progress and return to the question later.
- **Submit Assignment**: Once all questions are answered, click here to submit your assignment.
#### Graph Details:
There are no explicit graphs or diagrams in this instruction. The task primarily involves interpreting the given text and using the provided Standard Normal Distribution Table.
---
**Note**: This exercise is part of a larger set of questions in an online assignment from McGraw-Hill Education focused on understanding statistical concepts through practical application.
---
Expert Solution
This question has been solved!
Explore an expertly crafted, step-by-step solution for a thorough understanding of key concepts.

Step by stepSolved in 2 steps

Knowledge Booster


Learn more about
Need a deep-dive on the concept behind this application? Look no further. Learn more about this topic, statistics and related others by exploring similar questions and additional content below.Similar questions
- Find the area of the shaded region. The graph depicts the standard normal distribution with mean 0 and standard deviation 1. Click to view page 1 of the table. Click to view page 2 of the table. z=0.93 The area of the shaded region is . (Round to four decimal places as needed.) Enter your answer in the answer box. searcharrow_forwardUse the standard normal table to find the z-score that corresponds to the given percentile. If the area is not in the table, use the entry closest to the area. If the area is halfway between two entries, use the z-score halfway between the corresponding z-scores. If convenient, use technology to find the z-score. P4 The z-score that corresponds to P4 is (Round to two decimal places as needed.)arrow_forwardUse the standard normal table to find the z-score that corresponds tot the given percentile. If the area is not on the table, use the entry closest to the area. If the area is halfway between two entries, use the z-score halfway between the corresponding z-scores. P 95arrow_forward
- The time to complete an exam is approximately Normal with a mean of 48 minutes and a standard deviation of 7 minutes. The bell curve below represents the distribution for testing times. The scale on the horizontal axis is equal to the standard deviation. Fill in the indicated boxes. H = 48 o = 7 H- 30 H-20 μ+2σ μ+ 3arrow_forwardFind the indicated z score. The graph depicts the standard normal distribution with mean 0 and standard deviation 1 . Shaded area is 0.8737 .arrow_forwardUse the standard normal table to find the z-score that corresponds to the given percentile. If the area is not in the table, use the entry closest to the area. If the area is halfway between two entries, use the z-score halfway between the corresponding z-scores. If convenient, use technology to find the z-score. P18 The z-score that corresponds to P18 isarrow_forward
- Find the margin of error for the given values of c, s, and n. c = 0.99, s = 3.1, n = 27 Click the icon to view the t-distribution table. The margin of error is (Round to one decimal place as needed.)arrow_forwardFind the area of the shaded region. The graph depicts the standard normal distribution with mean O and standard deviation 1. Click to view page 1 of the table. Click to view page 2 of the table. The area of the shaded region is (Round to four decimal places as needed.) z = 0.83arrow_forward
arrow_back_ios
arrow_forward_ios
Recommended textbooks for you
- MATLAB: An Introduction with ApplicationsStatisticsISBN:9781119256830Author:Amos GilatPublisher:John Wiley & Sons Inc
 Probability and Statistics for Engineering and th...StatisticsISBN:9781305251809Author:Jay L. DevorePublisher:Cengage Learning
 Statistics for The Behavioral Sciences (MindTap C...StatisticsISBN:9781305504912Author:Frederick J Gravetter, Larry B. WallnauPublisher:Cengage Learning
  Elementary Statistics: Picturing the World (7th E...StatisticsISBN:9780134683416Author:Ron Larson, Betsy FarberPublisher:PEARSON
 The Basic Practice of StatisticsStatisticsISBN:9781319042578Author:David S. Moore, William I. Notz, Michael A. FlignerPublisher:W. H. Freeman
 Introduction to the Practice of StatisticsStatisticsISBN:9781319013387Author:David S. Moore, George P. McCabe, Bruce A. CraigPublisher:W. H. Freeman
MATLAB: An Introduction with Applications
Statistics
ISBN:9781119256830
Author:Amos Gilat
Publisher:John Wiley & Sons Inc
Probability and Statistics for Engineering and th...
Statistics
ISBN:9781305251809
Author:Jay L. Devore
Publisher:Cengage Learning
Statistics for The Behavioral Sciences (MindTap C...
Statistics
ISBN:9781305504912
Author:Frederick J Gravetter, Larry B. Wallnau
Publisher:Cengage Learning
Elementary Statistics: Picturing the World (7th E...
Statistics
ISBN:9780134683416
Author:Ron Larson, Betsy Farber
Publisher:PEARSON
The Basic Practice of Statistics
Statistics
ISBN:9781319042578
Author:David S. Moore, William I. Notz, Michael A. Fligner
Publisher:W. H. Freeman
Introduction to the Practice of Statistics
Statistics
ISBN:9781319013387
Author:David S. Moore, George P. McCabe, Bruce A. Craig
Publisher:W. H. Freeman