Concept explainers
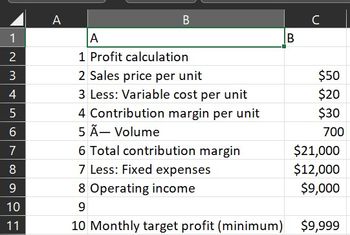
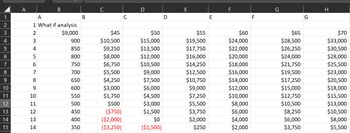
Using the worksheet pictured above, answer the following questions:
a.
Describe the steps you would follow to create the Profit calculation portion of the worksheet. Within the Profit calculation portion of the worksheet pictured, which cells would contain formulas? Specify each cell that would contain a formula and what each of those formulas would be.
b.
Describe the steps you would follow to create the Data table portion of the worksheet pictured.
c.
What is the current break even volume of sales if the selling price remains at $50? How do you know?
d.
If the company raises the selling price to $60 and sells 600 units, what would be the operating income?
e.
If the company's suppliers increase the cost of direct materials, would you expect the table to contain the same, fewer, or more shaded cells?
f.
If the company can negotiate lower plant property taxes with the county, would you expect the table to contain the same, fewer, or more shaded cells?
g.
If the company increased its target profit goal to $15,000 per month, would you expect the table to contain the same, fewer, or more shaded cells?


Trending nowThis is a popular solution!
Step by stepSolved in 3 steps

- Didn't return any results, therefore the code is incorrect.arrow_forwardI need the answer as soon as possiblearrow_forwardAs of the time of writing, Damon Davis was completing out the paperwork for Drano Plumbing. He estimated a $50,000 net profit would be made. He counted the columns of the balance sheet and knew how much was in the credit column ($300,000) and how much was in the negative column ($400,000). What, in your opinion, was the most plausible reason for the discrepancy in the results? What should he do next to identify the issue's cause if this wasn't the cause of the issue?arrow_forward
- how to Create three or more SQL Data Control Language (DCL) Statements using the Homework Database: EMPLOYEE, STORE, REGION, and SUPPLIER Database. Create a new user statement for the database. The user name should be based on yourself containing your name. Statements that grant privileges to the new user. Statements granting privileges to at least 2 of the tables in the assigned database Statements that revoke privileges to the new user. Statements revoking privileges to at least 2 of the tables in the assigned Database the home work data base: -- creating the RegionStore DataBase DROP DATABASE IF EXISTS RegionStore; CREATE DATABASE RegionStore; USE RegionStore; -- creating the Region table CREATE TABLE Region ( regionID VARCHAR(10), regionName VARCHAR(50), supervisor VARCHAR(50), CONSTRAINT PRIMARY KEY (regionID) ); -- creating the store table CREATE TABLE Store ( storeID VARCHAR (10), storeAddress VARCHAR (50), phone…arrow_forwardHow do we choose a model for Microsoft Access table design?arrow_forwardUse the content of the AdventureWorks sample database. Identify and explain which field on what table tells you whether a product will be built or bought?arrow_forward
- Choose a title, e.g. Database. (Company, Music, Movie, Library, Hospital or ...... University Databases are not accepted, because these databases are mentioned a lot on lectures or Internet) 1. Create a list of data items that will be stored in your project. For example, in library project, you may ask the librarian about business requirements. 2. List all the business requirements that you gathered from users. Make sure to explain what requirements gathering method you used. 3. Find and list all entities. 4. Find the attributes of entities (the attributes are data items that you already found) 5. Define restrictions for each attribute (e.g. Number of digits in student ID, range of values for Age attribute ) 6. Define relationships between entities and their types (Explain how you found the type of the relationships) 7. Create Entity-Relation (ER) model of your database. 8. Create necessary tables for your database. 9. Insert data in your tables. 10. Show in which normal forms your…arrow_forward1. Create a database diagram that shows the relationships between the seven tables in the MyGuitarShop database. (The administrators table is not related to the other six tables.) 2. Design a database diagram for a database that stores information about the downloads that users make from a website. Each user must have an email address, first name, and last name. Each user can have one or more downloads. Each download must have a filename and download date/time. Each product can be related to one or more downloads. Each product must have a name.arrow_forwardThere is a great deal of flexibility in how keys are disseminated. Explain what's best and why it's the finest.arrow_forward
- explain the pros and cons of placing constraints on a column in a table.arrow_forwardusing the design file in the image attached to the question : Normalize the database in the design file Be aware of the possibility of duplicate data. Name in Role and Employee and Emp_Contact_name all refer to the same data. Name and Email in Vendor refer to the Vendor. Assumptions made: An employee works with one or more vendors. An employee may have none or many dependents. An employee may have many roles over the employee's work history and a record should be retained for each role.arrow_forwardTask #3 – From the scratch to normalized tables In this task, we will start from the scratch. Following is the description of a campus housing’s business process. Read the process description and develop 3NF tables. Use the format in the example below. Example) PROJECT (ProjectNum, Proj_Name, Start_Date) EMP(Emp_Num, Emp_Name, Job_Class) ** Bold and underline the primary key Description of business processarrow_forward
 Database System ConceptsComputer ScienceISBN:9780078022159Author:Abraham Silberschatz Professor, Henry F. Korth, S. SudarshanPublisher:McGraw-Hill Education
 Starting Out with Python (4th Edition)Computer ScienceISBN:9780134444321Author:Tony GaddisPublisher:PEARSON
 Digital Fundamentals (11th Edition)Computer ScienceISBN:9780132737968Author:Thomas L. FloydPublisher:PEARSON
 C How to Program (8th Edition)Computer ScienceISBN:9780133976892Author:Paul J. Deitel, Harvey DeitelPublisher:PEARSON
 Database Systems: Design, Implementation, & Manag...Computer ScienceISBN:9781337627900Author:Carlos Coronel, Steven MorrisPublisher:Cengage Learning
 Programmable Logic ControllersComputer ScienceISBN:9780073373843Author:Frank D. PetruzellaPublisher:McGraw-Hill Education


