MATLAB: An Introduction with Applications
6th Edition
ISBN: 9781119256830
Author: Amos Gilat
Publisher: John Wiley & Sons Inc
expand_more
expand_more
format_list_bulleted
Concept explainers
Question

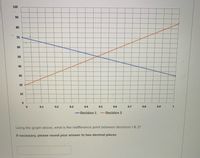
Transcribed Image Text:100
90
80
70
60
50
40
30
20
10
0.1
0.2
0.3
0.4
0.5
0.6
0.7
0.8
0.9
1
-Decision 1
-Decision 2
Using the graph above, what is the indifference point between decisions 1 & 2?
If necessary, please round your answer to two decimal places
Expert Solution
This question has been solved!
Explore an expertly crafted, step-by-step solution for a thorough understanding of key concepts.
This is a popular solution
Trending nowThis is a popular solution!
Step by stepSolved in 2 steps

Knowledge Booster
Learn more about
Need a deep-dive on the concept behind this application? Look no further. Learn more about this topic, statistics and related others by exploring similar questions and additional content below.Similar questions
- DECISION TREE ANALYSIS... YOU CAN USE A PEN AND PAPER, AND UPLOAD YOUR ANSWER. ALSO DRAW THE DECISION TREEarrow_forwardBased on the line graph shown, how did Google's stock price perform between March 2015 and August 2015? Alphabet/Google (GOOG) closing stock prices 800 750 700 650 600 550 500 450 Date (A The stock price increased. (B) There is not enough information to make a determination. The stock price decreased. D) There was no change. Stock price (USD) 2-Mar-2015 1-Apr-2015 1-May-2015 1-Jun-2015 1-Jul-2015 3-Aug-2015 1-Sep-2015 1-Oct-2015 2-Nov-2015 1-Dec-2015 4-Jan-2016 1-Feb-2016 1-Mar-2016arrow_forwardSet your utility for $0 to be 0 and $1 million to be 100. Apply the simple decision tree used in determining your utility for money, where the lottery has a prize of $1 million if you win and $0 if you lose, to determine your utility for $500,000 and $200,000. Use these 4 utilities to draw your utility curve for money.arrow_forward
- A large supermarket chain has invested heavily in data, technology, and analytics. Feeding predictive models with data from an infrared sensor system to anticipate when shoppers will reach the checkout counters, they are able to alert workers to open more checkout lines as needed. This has allowed them to lower their avera checkout time from four minutes to less than 30 seconds. Consider the data in the following table containing 32 observations. Suppose each observation gives the arrival time (measured in minutes before p.m.) and the shopping time (measured in minutes). O Arrival Time (minutes before 6:00 p.m.) Shopping Time (Minutes) 58 21 59 83 54 96 39 13 0 133 55 0 92 12 4 28 Shopping Time (minutes) 23 18 25 28 40 45 33 25 12 53 21 13 37 15 12 17 20 40 60 80 100 120 Arrival Time (Minutes Before 6:00 p.m.) Arrival Time (minutes before 6:00 p.m.) 140 38 AO 15 78 32 23 18 24 38 57 113 30 109 (a) Develop scatter diagram for arrival time as the independent variable. 47 104 72 112…arrow_forwardHi, please answer both. Thanks!arrow_forwardThank you!arrow_forward
- Exercise 2. Marginal and Conditional Relationships can be Very Different. For 100 mild cases of eczema, a new treatment had a higher cure rate than the old treatment (33.3% of 90 vs. 20% of 10). For 100 severe cases of eczema, again the new treatment had a higher cure rate than the old treatment (60% of 20 vs. 50% of 80). Over all 200 eczema cases, however, the old treatment had a higher cure rate than the new treatment- i.e. Simpson's Paradox strikes again. (a) Compute the overall cure rates for the new and old treatments. (b) Which treatment, old or new, would you choose and why?arrow_forwardHelparrow_forward
arrow_back_ios
arrow_forward_ios
Recommended textbooks for you
 MATLAB: An Introduction with ApplicationsStatisticsISBN:9781119256830Author:Amos GilatPublisher:John Wiley & Sons Inc
 Probability and Statistics for Engineering and th...StatisticsISBN:9781305251809Author:Jay L. DevorePublisher:Cengage Learning
 Statistics for The Behavioral Sciences (MindTap C...StatisticsISBN:9781305504912Author:Frederick J Gravetter, Larry B. WallnauPublisher:Cengage Learning
 Elementary Statistics: Picturing the World (7th E...StatisticsISBN:9780134683416Author:Ron Larson, Betsy FarberPublisher:PEARSON
 The Basic Practice of StatisticsStatisticsISBN:9781319042578Author:David S. Moore, William I. Notz, Michael A. FlignerPublisher:W. H. Freeman
 Introduction to the Practice of StatisticsStatisticsISBN:9781319013387Author:David S. Moore, George P. McCabe, Bruce A. CraigPublisher:W. H. Freeman

MATLAB: An Introduction with Applications
Statistics
ISBN:9781119256830
Author:Amos Gilat
Publisher:John Wiley & Sons Inc

Probability and Statistics for Engineering and th...
Statistics
ISBN:9781305251809
Author:Jay L. Devore
Publisher:Cengage Learning

Statistics for The Behavioral Sciences (MindTap C...
Statistics
ISBN:9781305504912
Author:Frederick J Gravetter, Larry B. Wallnau
Publisher:Cengage Learning

Elementary Statistics: Picturing the World (7th E...
Statistics
ISBN:9780134683416
Author:Ron Larson, Betsy Farber
Publisher:PEARSON

The Basic Practice of Statistics
Statistics
ISBN:9781319042578
Author:David S. Moore, William I. Notz, Michael A. Fligner
Publisher:W. H. Freeman

Introduction to the Practice of Statistics
Statistics
ISBN:9781319013387
Author:David S. Moore, George P. McCabe, Bruce A. Craig
Publisher:W. H. Freeman