
MATLAB: An Introduction with Applications
6th Edition
ISBN: 9781119256830
Author: Amos Gilat
Publisher: John Wiley & Sons Inc
expand_more
expand_more
format_list_bulleted
Related questions
Question
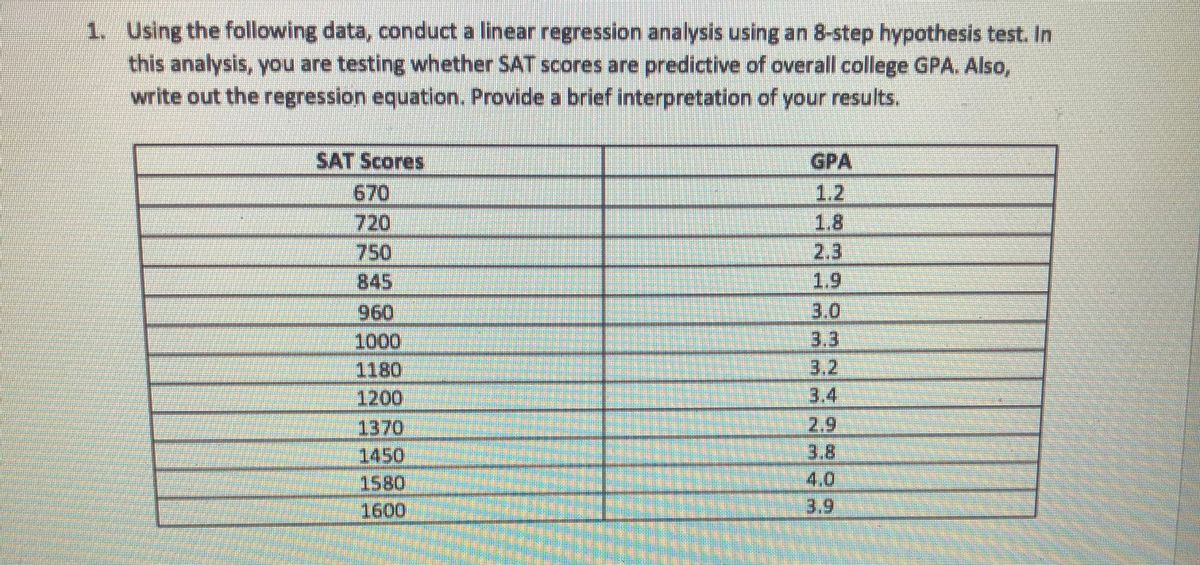

Transcribed Image Text:1. Using the following data, conduct a linear regression analysis using an 8-step hypothesis test. In
this analysis, you are testing whether SAT scores are predictive of overall college GPA. Also,
write out the regression equation. Provide a brief interpretation of your results.
SAT Scores
GPA
670
720
1.2
1.8
2.3
1.9
750
845
960
3.0
1000
3.3
3.2
1180
1200
3.4
2.9
3.8
4.0
3.9
1370
1450
1580
1600
Expert Solution
This question has been solved!
Explore an expertly crafted, step-by-step solution for a thorough understanding of key concepts.

Step by stepSolved in 2 steps

Follow-up Questions
Read through expert solutions to related follow-up questions below.
Follow-up Question
8 step hypothesis
Solution
by Bartleby Expert
Follow-up Questions
Read through expert solutions to related follow-up questions below.
Follow-up Question
8 step hypothesis
Solution
by Bartleby Expert
Knowledge Booster

Similar questions
- Interpret the regression results.arrow_forwardFind the regression equation, letting the diameter be the predictor (x) variable. Find the best predicted circumference of a beachball with a diameter of 44.4 cm. How does the result compare to the actual circumference of 139.5 cm? Use a significance level of 0.05. Baseball Basketball Golf Soccer Tennis Ping-Pong Volleyball Diameter 7.3 23.8 4.2 22.3 7.1 4.0 21.2 Circumference 22.9 74.8 13.2 70.1 22.3 12.6 66.6 LOADING... Click the icon to view the critical values of the Pearson correlation coefficient r.arrow_forwardFind the regression equation, letting the diameter be the predictor (x) variable. Find the best predicted circumference of a marble with a diameter of 1.9 cm. How does the result compare to the actual circumference of 6.0 cm? Use a significance level of 0.05. Baseball Basketball Golf Soccer Tennis Ping-Pong Volleyball 5 Diameter 7.4 23.6 4.3 21.7 7.1 3.9 21.5 Circumference 23.2 74.1 13.5 68.2 22.3 12.3 67.5arrow_forward
- Using the data, run a regression where you control for “Promotion,” and test the effect of “Wins” on “Attendance”. Does “Promotion” have a significant effect on “Attendance”? Wins Promotion Attendance 4 29500 36300 6 55700 40100 6 71300 41200 8 87000 53000 6 75000 44000 7 72000 45600 5 55300 39000 7 81600 47500arrow_forward4arrow_forwardThe accompanying table shows a portion of data that refers to the property taxes owed by a homeowner (in $) and the size of the home (in square feet) in an affluent suburb 30 miles outside New York City. Click here for the Excel Data File Taxes Size 21,987 2,403 17,353 2,451 29,238 2,866 a. Estimate the sample regression equation that enables us to predict property Taxes on the basis of the size of the home. (Round your answers to 2 decimal places.) Taxes = + Size. b. Interpret the slope coefficient. O As Property Taxes increase by 1 dollar, the size of the house increases by 6.71 ft. O As Size increases by 1 square foot, the property taxes are predicted to increase by $6.71. c. Predict the property Taxes for a 1,400-square-foot home. (Round coefficient estimates to at least 4 decimal places and final answer to 2 decimal places.) Taxesarrow_forward
arrow_back_ios
arrow_forward_ios
Recommended textbooks for you
- MATLAB: An Introduction with ApplicationsStatisticsISBN:9781119256830Author:Amos GilatPublisher:John Wiley & Sons Inc
 Probability and Statistics for Engineering and th...StatisticsISBN:9781305251809Author:Jay L. DevorePublisher:Cengage Learning
 Statistics for The Behavioral Sciences (MindTap C...StatisticsISBN:9781305504912Author:Frederick J Gravetter, Larry B. WallnauPublisher:Cengage Learning
  Elementary Statistics: Picturing the World (7th E...StatisticsISBN:9780134683416Author:Ron Larson, Betsy FarberPublisher:PEARSON
 The Basic Practice of StatisticsStatisticsISBN:9781319042578Author:David S. Moore, William I. Notz, Michael A. FlignerPublisher:W. H. Freeman
 Introduction to the Practice of StatisticsStatisticsISBN:9781319013387Author:David S. Moore, George P. McCabe, Bruce A. CraigPublisher:W. H. Freeman
MATLAB: An Introduction with Applications
Statistics
ISBN:9781119256830
Author:Amos Gilat
Publisher:John Wiley & Sons Inc
Probability and Statistics for Engineering and th...
Statistics
ISBN:9781305251809
Author:Jay L. Devore
Publisher:Cengage Learning
Statistics for The Behavioral Sciences (MindTap C...
Statistics
ISBN:9781305504912
Author:Frederick J Gravetter, Larry B. Wallnau
Publisher:Cengage Learning
Elementary Statistics: Picturing the World (7th E...
Statistics
ISBN:9780134683416
Author:Ron Larson, Betsy Farber
Publisher:PEARSON
The Basic Practice of Statistics
Statistics
ISBN:9781319042578
Author:David S. Moore, William I. Notz, Michael A. Fligner
Publisher:W. H. Freeman
Introduction to the Practice of Statistics
Statistics
ISBN:9781319013387
Author:David S. Moore, George P. McCabe, Bruce A. Craig
Publisher:W. H. Freeman