
MATLAB: An Introduction with Applications
6th Edition
ISBN: 9781119256830
Author: Amos Gilat
Publisher: John Wiley & Sons Inc
expand_more
expand_more
format_list_bulleted
Related questions
Topic Video
Question
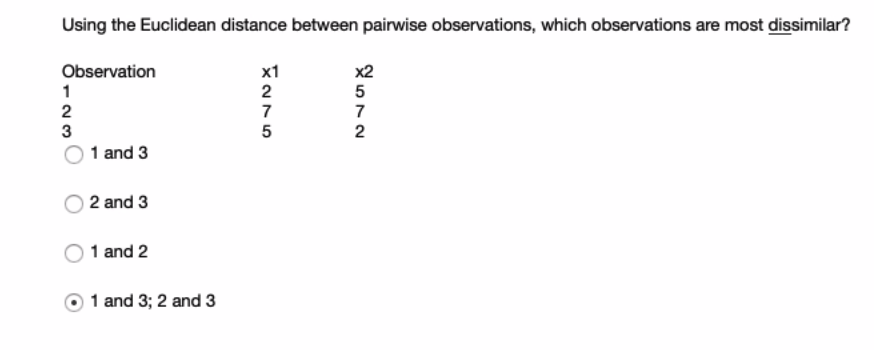

Transcribed Image Text:Using the Euclidean distance between pairwise observations, which observations are most dissimilar?
Observation
х1
x2
1
2
2
7
7
3
2
1 and 3
2 and 3
1 and 2
1 and 3; 2 and 3
Expert Solution
This question has been solved!
Explore an expertly crafted, step-by-step solution for a thorough understanding of key concepts.

This is a popular solution

Trending nowThis is a popular solution!

Step by stepSolved in 2 steps

Knowledge Booster


Learn more about
Need a deep-dive on the concept behind this application? Look no further. Learn more about this topic, statistics and related others by exploring similar questions and additional content below.Similar questions
- How would you answer these questions? What is the logic behind them?arrow_forward#6. Basic Computation: Five-Number Summary, Interquartile Range 2 5 5 6 7 8 8 9 10 12 (a) Find the low, Q1, Median, Q3, and High. (b) Find the interquartile range (c) Make a box-and-whisker plot.arrow_forwardC cleverPertel 1. Curve Parformante Auth Question 3/14 > NEXT A BOOKMARK 3 Find the measures of m andn in the parallelogram below. 9. 3m m+8 2n- m = n =arrow_forward
- Choose the scatter plot that you would least likely model the relationship using a linear model. Question 18 options a) b) c) C d)arrow_forwardGiven the data points a= [6.6, 6.2, 1. ] b- [9.7, 9.9, 2. ] c=[8., 8.3, 2. ] d= [6.3, 5.4, 1. ] which points are closest according to the Manhattan distance metric? O c and d O a and d O a and c Ob and c Ob and darrow_forwardThe following computer output was used as a part of the model adequacy check. What is the purpose of this plot and what can you conclude based in this plotarrow_forward
- Also what is the interquartile range of the data? A) 40 B)15 C)35 D)25arrow_forwardI chose option 1. I believe that the population mean number of times that adults eat fruit with their breakfast is greater than 3 times. I spoke with 14 adults and found that they had fruit with breakfast 7,2,3,0,0,0,4,7,7,7,4,4,5,and 0 times in the past week. Test this hypothesis at the .05 significance level and assume a random sample.arrow_forward
arrow_back_ios
arrow_forward_ios
Recommended textbooks for you
- MATLAB: An Introduction with ApplicationsStatisticsISBN:9781119256830Author:Amos GilatPublisher:John Wiley & Sons Inc
 Probability and Statistics for Engineering and th...StatisticsISBN:9781305251809Author:Jay L. DevorePublisher:Cengage Learning
 Statistics for The Behavioral Sciences (MindTap C...StatisticsISBN:9781305504912Author:Frederick J Gravetter, Larry B. WallnauPublisher:Cengage Learning
  Elementary Statistics: Picturing the World (7th E...StatisticsISBN:9780134683416Author:Ron Larson, Betsy FarberPublisher:PEARSON
 The Basic Practice of StatisticsStatisticsISBN:9781319042578Author:David S. Moore, William I. Notz, Michael A. FlignerPublisher:W. H. Freeman
 Introduction to the Practice of StatisticsStatisticsISBN:9781319013387Author:David S. Moore, George P. McCabe, Bruce A. CraigPublisher:W. H. Freeman
MATLAB: An Introduction with Applications
Statistics
ISBN:9781119256830
Author:Amos Gilat
Publisher:John Wiley & Sons Inc
Probability and Statistics for Engineering and th...
Statistics
ISBN:9781305251809
Author:Jay L. Devore
Publisher:Cengage Learning
Statistics for The Behavioral Sciences (MindTap C...
Statistics
ISBN:9781305504912
Author:Frederick J Gravetter, Larry B. Wallnau
Publisher:Cengage Learning
Elementary Statistics: Picturing the World (7th E...
Statistics
ISBN:9780134683416
Author:Ron Larson, Betsy Farber
Publisher:PEARSON
The Basic Practice of Statistics
Statistics
ISBN:9781319042578
Author:David S. Moore, William I. Notz, Michael A. Fligner
Publisher:W. H. Freeman
Introduction to the Practice of Statistics
Statistics
ISBN:9781319013387
Author:David S. Moore, George P. McCabe, Bruce A. Craig
Publisher:W. H. Freeman