
MATLAB: An Introduction with Applications
6th Edition
ISBN: 9781119256830
Author: Amos Gilat
Publisher: John Wiley & Sons Inc
expand_more
expand_more
format_list_bulleted
Related questions
Question
Using the accompanying colleges and universities data to find 95% confidence intervals for the median SAT for each of the two groups, liberal arts colleges and research universities. Based on these confidence intervals, does there appear to be a difference in the median SAT scores between the two groups?
For the liberal arts colleges, the 95% confidence interval is?(round to four decimal places as needed)
For the research universities, the 95% confidence interval is?(round to four decimal places as needed)
Based on the results, does there appear to be a difference in the median SAT scores between the two groups?
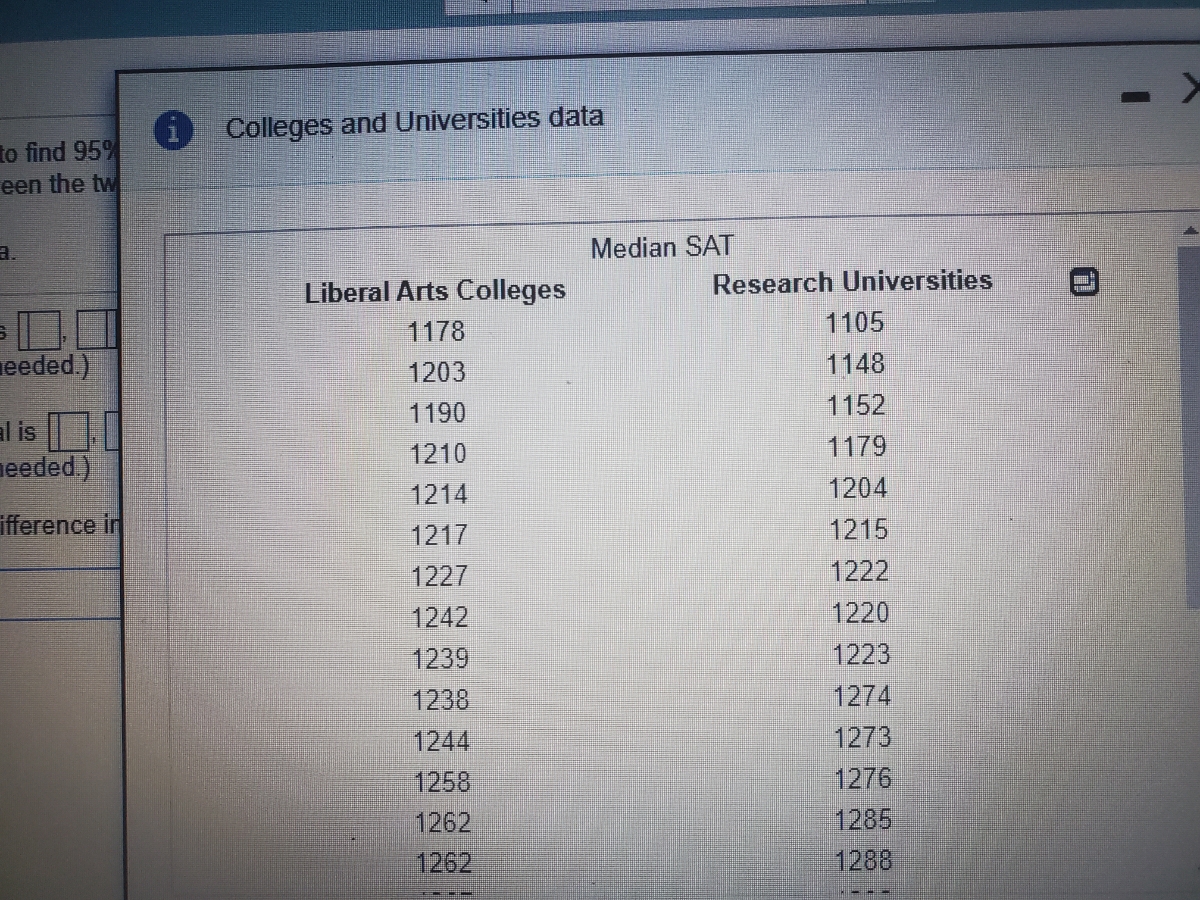

Transcribed Image Text:1 Colleges and Universities data
to find 95%
een the tw
a.
Median SAT
Liberal Arts Colleges
Research Universities
1178
1105
eeded)
1203
1148
1190
1152
al is
eeded)
1210
1179
1214
1204
ifference in
1217
1215
1227
1222
1242
1220
1239
1223
1238
1274
1244
1273
1276
1258
1262
1262
1285
1288

Transcribed Image Text:tw
1238
1274
1244
1273
1258
1276
1262
1285
1262
1288
1267
1293
1254
1302
ce in
1284
1310
1290
1336
1283
1340
1310
1342
1309
1363
1300
1379
1314
1368
1317
1395
1330
Expert Solution
This question has been solved!
Explore an expertly crafted, step-by-step solution for a thorough understanding of key concepts.

This is a popular solution

Trending nowThis is a popular solution!

Step by stepSolved in 3 steps

Knowledge Booster


Learn more about
Need a deep-dive on the concept behind this application? Look no further. Learn more about this topic, statistics and related others by exploring similar questions and additional content below.Similar questions
- The figure to the right shows the results of a survey in which 1018 adults from Country A, 1025 adults from Country B, 1005 adults from Country C, 999 adults from Country D, and 999 adults from Country E were asked whether national identity is strongly tied to birthplace. Construct a 95% confidence interval for the population proportion of adults who say national identity is strongly tied to birthplace for each country listed. The 95% confidence interval for the proportion of adults from Country A who say national identity is strongly tied to birthplace is (____),(____) The 95% confidence interval for the proportion of adults from Country B who say national identity is strongly tied to birthplace is (____),(____) The 95% confidence interval for the proportion of adults from Country C who say national identity is strongly tied to birthplace is (____),(____) The 95% confidence interval for the proportion of adults from Country D who say national identity is strongly tied to…arrow_forwardA magazine provided results from a poll of 1000 adults who were asked to identify their favorite pie. Among the 1000 respondents, 11% chose chocolate pie, and the margin of error was given as +5 percentage points. What values do p, q. n. E, and p represent? If the confidence level is 95%, what is the value of a? The value of p is The value of q is The value of n is The value of E is The value of p isarrow_forwardConstruct a 95% confidence interval for p1 - p2 for a survey that finds 30% of 240 males and 41% of 200 females are opposed to the death penalty. Group of answer choices a.(-0.200, -0.021) b.(-1.532, 1.342) c.(-1.324, 1.512) d.(-0.561, 0.651)arrow_forward
- The Pizza Shop wanted to determine what of its customers ordered an only cheese pizza. Out of 90 customers surveyed, 20 ordered only cheese Pizza. What is the 90% confidence interval of the true proportion of customers who order only cheese Pizza?arrow_forwardA magazine provided results from a poll of 1500 adults who were asked to identify their favorite pie. Among the 1500 respondents, 13% chose chocolate pie, and the margin of error was given as +3 percentage points. What values do p, q, n, E, and p represent? If the confidence level is 95%, what is the value of a? The value of p is The value of a is The value of n is The value of E is The value of p isarrow_forwardA random sample of high school students is used to estimate the mean time all high school students study for Algebra II tests. A 99% confidence interval based on this sample is: 1.7 hours to 3.1 hours. What is the sample mean?arrow_forward
- The question was asking for 99% confidence interval for poparrow_forwardSuppose the English department of a local university has a total of 105 faculty members. Of this number, 24 (about 23%) are part-time instructors. Is it appropriate to find a confidence interval for the percentage of part-time instructors in the department? Find a 95% confidence interval or explain why you should not find a confidence interval for the percentage of part-time instructors in the English department.arrow_forwardOne year’s survey results, of 1525 respondents, 846 said that they expected difficulty finding a job. Find a 95% confidence interval for the population proportion of students who expect difficulty finding a job.arrow_forward
- If 390 people were asked if they liked dogs, and 82% said they did What is the margin of error of this poll, at the 95% confidence level with your answer to three decimals?arrow_forwardIf two people used the same data and one person made a 90% confidence interval and the other person made a 95% confidence interval for p, which interval would be more narrow? is it; a. The 90% Confidence interval b. The 95% Confidence interval c. We cannot tell from the information alone.arrow_forwardNEED ANSWER ASAP HELParrow_forward
arrow_back_ios
SEE MORE QUESTIONS
arrow_forward_ios
Recommended textbooks for you
- MATLAB: An Introduction with ApplicationsStatisticsISBN:9781119256830Author:Amos GilatPublisher:John Wiley & Sons Inc
 Probability and Statistics for Engineering and th...StatisticsISBN:9781305251809Author:Jay L. DevorePublisher:Cengage Learning
 Statistics for The Behavioral Sciences (MindTap C...StatisticsISBN:9781305504912Author:Frederick J Gravetter, Larry B. WallnauPublisher:Cengage Learning
  Elementary Statistics: Picturing the World (7th E...StatisticsISBN:9780134683416Author:Ron Larson, Betsy FarberPublisher:PEARSON
 The Basic Practice of StatisticsStatisticsISBN:9781319042578Author:David S. Moore, William I. Notz, Michael A. FlignerPublisher:W. H. Freeman
 Introduction to the Practice of StatisticsStatisticsISBN:9781319013387Author:David S. Moore, George P. McCabe, Bruce A. CraigPublisher:W. H. Freeman
MATLAB: An Introduction with Applications
Statistics
ISBN:9781119256830
Author:Amos Gilat
Publisher:John Wiley & Sons Inc
Probability and Statistics for Engineering and th...
Statistics
ISBN:9781305251809
Author:Jay L. Devore
Publisher:Cengage Learning
Statistics for The Behavioral Sciences (MindTap C...
Statistics
ISBN:9781305504912
Author:Frederick J Gravetter, Larry B. Wallnau
Publisher:Cengage Learning
Elementary Statistics: Picturing the World (7th E...
Statistics
ISBN:9780134683416
Author:Ron Larson, Betsy Farber
Publisher:PEARSON
The Basic Practice of Statistics
Statistics
ISBN:9781319042578
Author:David S. Moore, William I. Notz, Michael A. Fligner
Publisher:W. H. Freeman
Introduction to the Practice of Statistics
Statistics
ISBN:9781319013387
Author:David S. Moore, George P. McCabe, Bruce A. Craig
Publisher:W. H. Freeman