
MATLAB: An Introduction with Applications
6th Edition
ISBN: 9781119256830
Author: Amos Gilat
Publisher: John Wiley & Sons Inc
expand_more
expand_more
format_list_bulleted
Related questions
Question
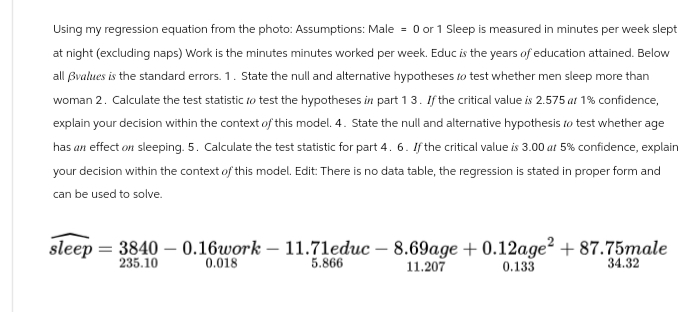

Transcribed Image Text:Using my regression equation from the photo: Assumptions: Male = 0 or 1 Sleep is measured in minutes per week slept
at night (excluding naps) Work is the minutes minutes worked per week. Educ is the years of education attained. Below
all ẞvalues is the standard errors. 1. State the null and alternative hypotheses to test whether men sleep more than
woman 2. Calculate the test statistic to test the hypotheses in part 13. If the critical value is 2.575 at 1% confidence,
explain your decision within the context of this model. 4. State the null and alternative hypothesis to test whether age
has an effect on sleeping. 5. Calculate the test statistic for part 4. 6. If the critical value is 3.00 at 5% confidence, explain
your decision within the context of this model. Edit: There is no data table, the regression is stated in proper form and
can be used to solve.
sleep 3840 -0.16work -11.71educ - 8.69age + 0.12age² + 87.75male
235.10
0.018
5.866
11.207
0.133
34.32
SAVE
AI-Generated Solution
info
AI-generated content may present inaccurate or offensive content that does not represent bartleby’s views.
Unlock instant AI solutions
Tap the button
to generate a solution
to generate a solution
Click the button to generate
a solution
a solution
Knowledge Booster

Similar questions
- 22. You are given the following value from a t-table as needed: P(t140 > 1.656) = 0.05 Association between student math and verbal scores on the SAT was modeled by a linear regression model using the output given below for sample scores for a graduating class from a high school. Find a 90% prediction interval for the Math score of a graduating student that has a verbal score of 500. Variable Count Mean Verbal 142 596.296 Math 142 612.099 Dependent variable is Math R-square = 46.9% s=71.75 with 142-2=140 df Variable Coefficient SE(Coeff) t-ratio P-value Intercept 209.554 34.35 6.1 <0.0001 Verbal 0.675 0.0568 11.9 <0.0001arrow_forward8- Hi Great Bartleby Team, I need help with this stats exercise, it has 3 parts so please provide an answer for all the parts. Thanks in advance. (please pay attention to the image posted.arrow_forwardz score z score for each for each value of value of Zzły х х -0.278 0.536 -0.149 -0.089 0.696 -0.062 -1.253 -1 -1.652 2.070 -0.714 -0.928 0.663 2.461 1.473 1.671 0.536 0.371 0.199 -0.089 4 -0.278 0.025 Σ: ỹ = 3.857 S, = 3.078 = 5.207 T= 4.286 s, = 3.200arrow_forward
- Please use all the given equations above to answer (e) please show the solution in details. I will rate it. Thanksarrow_forward2arrow_forwardA regression coefficient is given Match the correct equation with answers given below Y =0.00114x + 2.53 Y=1.662x + 83.34 Y = -1.04x + 50.3 Y= -0.667x + 52.6arrow_forward
- 1.64 and 1.63 is incorrect please help ()()))arrow_forwardAn automobile rental company wants to predict the yearly maintenance expense (Y) for an automobile using the number of miles driven during the year () and the age of the car (, in years) at the beginning of the year. The company has gathered the data on 10 automobiles and run a regression analysis with the results shown below:. Summary measures Multiple R 0.9689 R-Square 0.9387 Adj R-Square 0.9212 StErr of Estimate 72.218 Regression coefficients Coefficient Std Err t-value p-value Constant 33.796 48.181 0.7014 0.5057 Miles Driven 0.0549 0.0191 2.8666 0.0241 Age of car 21.467 20.573 1.0434 0.3314 Use the information above to estimate the annual maintenance expense for a 10 years old car with 60,000 miles.arrow_forwardThe regression line for Y vs X is given by Y = 0.82X + 59.1. The standard deviations for X and Y are 1.5 and 2.2 respectively. Suppose now we construct a regression line that uses Y to predict X. The predicted average increase of X when Y is increased by 1 unit is ______________. (Give your answer correct to 2 decimal places.)arrow_forward
- 2arrow_forward3. Regression analysis breaks scores on the DV into... (explain and give equations)arrow_forwardBelow table contains a data sample where X is the independent, and Y the dependent variable. Using the data, please conduct a regression analysis. Determine first the regression equation with the help of below graph and table, then answer all the questions. 1. The value of cell a is 2. The value of cell b is 3: The value of cell c is 4: The value of cell d is 5: The value of cell e is 6: The value of cell f is 7: The value of cell g is 8. The value of cell h is 9: The value of cell i is 10: The value of cell j is 11: The value of cell k is 12: The value of cell l is 13: The value of cell m is 14: The value of cell n is 15: The value of cell o is 16: The value of cell p is 17: The value of cell q is 18: The value of cell r is 19: The value of cell s is 20: The value of cell t is 21: The value of cell u is 22: The value of cell v is 23: The value of cell w is 24: The value of cell x is 25: The value of cell y is 26: The value of cell z is 27: The value of cell aa is 28: The value of cell…arrow_forward
arrow_back_ios
arrow_forward_ios
Recommended textbooks for you
- MATLAB: An Introduction with ApplicationsStatisticsISBN:9781119256830Author:Amos GilatPublisher:John Wiley & Sons Inc
 Probability and Statistics for Engineering and th...StatisticsISBN:9781305251809Author:Jay L. DevorePublisher:Cengage Learning
 Statistics for The Behavioral Sciences (MindTap C...StatisticsISBN:9781305504912Author:Frederick J Gravetter, Larry B. WallnauPublisher:Cengage Learning
  Elementary Statistics: Picturing the World (7th E...StatisticsISBN:9780134683416Author:Ron Larson, Betsy FarberPublisher:PEARSON
 The Basic Practice of StatisticsStatisticsISBN:9781319042578Author:David S. Moore, William I. Notz, Michael A. FlignerPublisher:W. H. Freeman
 Introduction to the Practice of StatisticsStatisticsISBN:9781319013387Author:David S. Moore, George P. McCabe, Bruce A. CraigPublisher:W. H. Freeman
MATLAB: An Introduction with Applications
Statistics
ISBN:9781119256830
Author:Amos Gilat
Publisher:John Wiley & Sons Inc
Probability and Statistics for Engineering and th...
Statistics
ISBN:9781305251809
Author:Jay L. Devore
Publisher:Cengage Learning
Statistics for The Behavioral Sciences (MindTap C...
Statistics
ISBN:9781305504912
Author:Frederick J Gravetter, Larry B. Wallnau
Publisher:Cengage Learning
Elementary Statistics: Picturing the World (7th E...
Statistics
ISBN:9780134683416
Author:Ron Larson, Betsy Farber
Publisher:PEARSON
The Basic Practice of Statistics
Statistics
ISBN:9781319042578
Author:David S. Moore, William I. Notz, Michael A. Fligner
Publisher:W. H. Freeman
Introduction to the Practice of Statistics
Statistics
ISBN:9781319013387
Author:David S. Moore, George P. McCabe, Bruce A. Craig
Publisher:W. H. Freeman