Using AD-AS diagram show how the change in productivity in the Ghanaian economy in 2017 affected the Real
Aggregate Demand -:
It refers to the amount of total spending on domestic goods and services which are produced in an economy at given price level within a given period of time.
1. Consumption
2. Investment
3. Government spending
4. Net exports (Exports - Imports)
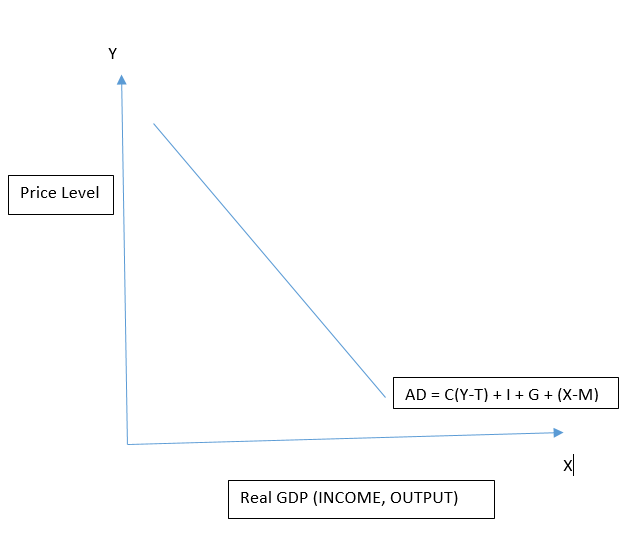
Diagram of Aggregate Demand Curve -:
The Downward-sloping Aggregate Demand curve shows the inverse relationship between the price level for outputs and the quantity of total spending in the economy.

Aggregate Supply -:
It refers to the total quantity of output that the firms produce at given price levels during a given period of time or in other words we can say it the Real GDP.
Main components of aggregate supply are Consumption and Saving. A major portion of income is spent on consumption of goods and services and the balance is saved.
Thus, national income (Y) or aggregate supply (AS) is sum of consumption expenditure (C) and savings (S).
Y = AS = C + S
Step by stepSolved in 6 steps with 3 images

- Taxes Transfers Investment Government Spending $590 $400 $3000 $150 $1000 $6000 Private Savings Consumer Spending Net Exports Using the above information, the capital inflow for the economy isarrow_forwardHow to evaluate the net economic change brought about by an event?arrow_forwardSuppose the Biden administration along with Congress pass a reform that makes it easier for foreigners to come and work in the US. At the same time, concerns about the increasing deficit lead the government to cut funding for research and development for the next 3 years. Use the model of AD/AS to explain how these policies would affect the [a] price level, [2] real GDP, and [c] unemploymentarrow_forward
- Use the AD/AS framework to explain how the economy adjusts in the short run and the long run to each of the following (assuming that the economy starts at potential GDP with no spare Capacity and a given price level): a) World energy prices rise and then settle at a new higher level, and this raises input prices for all domestic producers. b) There is a one-off fall in export demand which stays at the new lower level. c) The monetary policy makers lower their official interest rate and hold it at the new lower level. d)The government raises its current spending and keeps it at the new level. e)Say what might have happened to the other components of aggregate demand when the economy has adjusted to the change In d) in the long run.arrow_forwardif a country is on the recovery phase of the business cycle where are they on the ad as model.arrow_forwardAuthor claims, “The pandemic was unexpected shock. Climate change and climate policy are known shocks that can even more substantial impact on economic structures and macroeconomic stability.”Critically explain this statement by using AD-AS model.arrow_forward
- Where does GDP fit into an AD/AS model?arrow_forwarddue to the hard lockdowns in Australia, there has been a spike in Australians mental health being impacted negatively how has affected the economy on a micro level as well as a macro levelarrow_forwardWhat is most likely to happen to inflation and real output growthif a government raises taxes and its economy has a year of excellentweather for growing crops? Illustrate your verbal answer with a graph.Label everything!arrow_forward
- U.S. macroeconomic data are among the best in the world. Given what you learned in the Clear It Up "How do statisticians measure GDP?", does this surprise you, or does this simply reflect the complexity of a modern economy? Suppose GDP was modified to include the value - positive or negative - of changes in environmental quality. How could this be done accurately?arrow_forward1. Climate changes and the Ukrainian-Russian war disrupt global output. Malaysia imports agricultural products from overseas. Assume that the economy is initially operate at its full employment. Based on above situation, explain the effects of this on the economy in the short run. Use AD-AS diagram in your illustration.arrow_forwardCountry A faces both a rise in Real GDP and Price Level. What does this say about its AD and LRAS, explain with a diagram. Don,t copy from anywher. Do answer step by step. Answer Must be correct.arrow_forward

 Principles of Economics (12th Edition)EconomicsISBN:9780134078779Author:Karl E. Case, Ray C. Fair, Sharon E. OsterPublisher:PEARSON
 Engineering Economy (17th Edition)EconomicsISBN:9780134870069Author:William G. Sullivan, Elin M. Wicks, C. Patrick KoellingPublisher:PEARSON
 Principles of Economics (MindTap Course List)EconomicsISBN:9781305585126Author:N. Gregory MankiwPublisher:Cengage Learning
 Managerial Economics: A Problem Solving ApproachEconomicsISBN:9781337106665Author:Luke M. Froeb, Brian T. McCann, Michael R. Ward, Mike ShorPublisher:Cengage Learning
 Managerial Economics & Business Strategy (Mcgraw-...EconomicsISBN:9781259290619Author:Michael Baye, Jeff PrincePublisher:McGraw-Hill Education


