Question
1

Transcribed Image Text:3.3ME01
100E-00
100
200-00
2300
2-00
3.00E-00
3.ME+00
3600
4.00+00
434E-00
4E-00
000
66700
73M00
8.0-0
8.34-00
9.3-00
100-01
16-01
1.200
140-
14-0
1.50-0
Chart Title
6.00E-2
2.00E+02
1,00+0
-Series)
eries2
Series
Senes4
Serins
Line Series)- Liner Gene
Lintr Dele
Lr Beest
Liar elles

Transcribed Image Text:1.
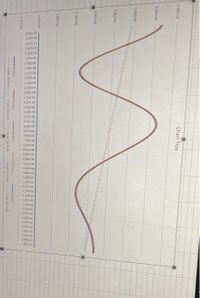
Use the trendline function from the angular position versus time graph
to determine the angular acceleration of the fidget spinner. Be sure to specify both
the numerical value and the units.
Expert Solution
This question has been solved!
Explore an expertly crafted, step-by-step solution for a thorough understanding of key concepts.
This is a popular solution
Trending nowThis is a popular solution!
Step by stepSolved in 2 steps with 1 images

Knowledge Booster
Similar questions
arrow_back_ios
SEE MORE QUESTIONS
arrow_forward_ios