
MATLAB: An Introduction with Applications
6th Edition
ISBN: 9781119256830
Author: Amos Gilat
Publisher: John Wiley & Sons Inc
expand_more
expand_more
format_list_bulleted
Related questions
Question
5. Use the standard error method to construct a 95% confidence interval for the true proportion of Americans who approve of the indictment of former President Trump
interpret your confifence inerval in the context of this situation.
6. Construct a 99% CI using the counting method and the graph.
explain how you determine your 99% CI using the graph given
interpret your confidence interval in the contect of this situation

Transcribed Image Text:10
0
20
30
Part A
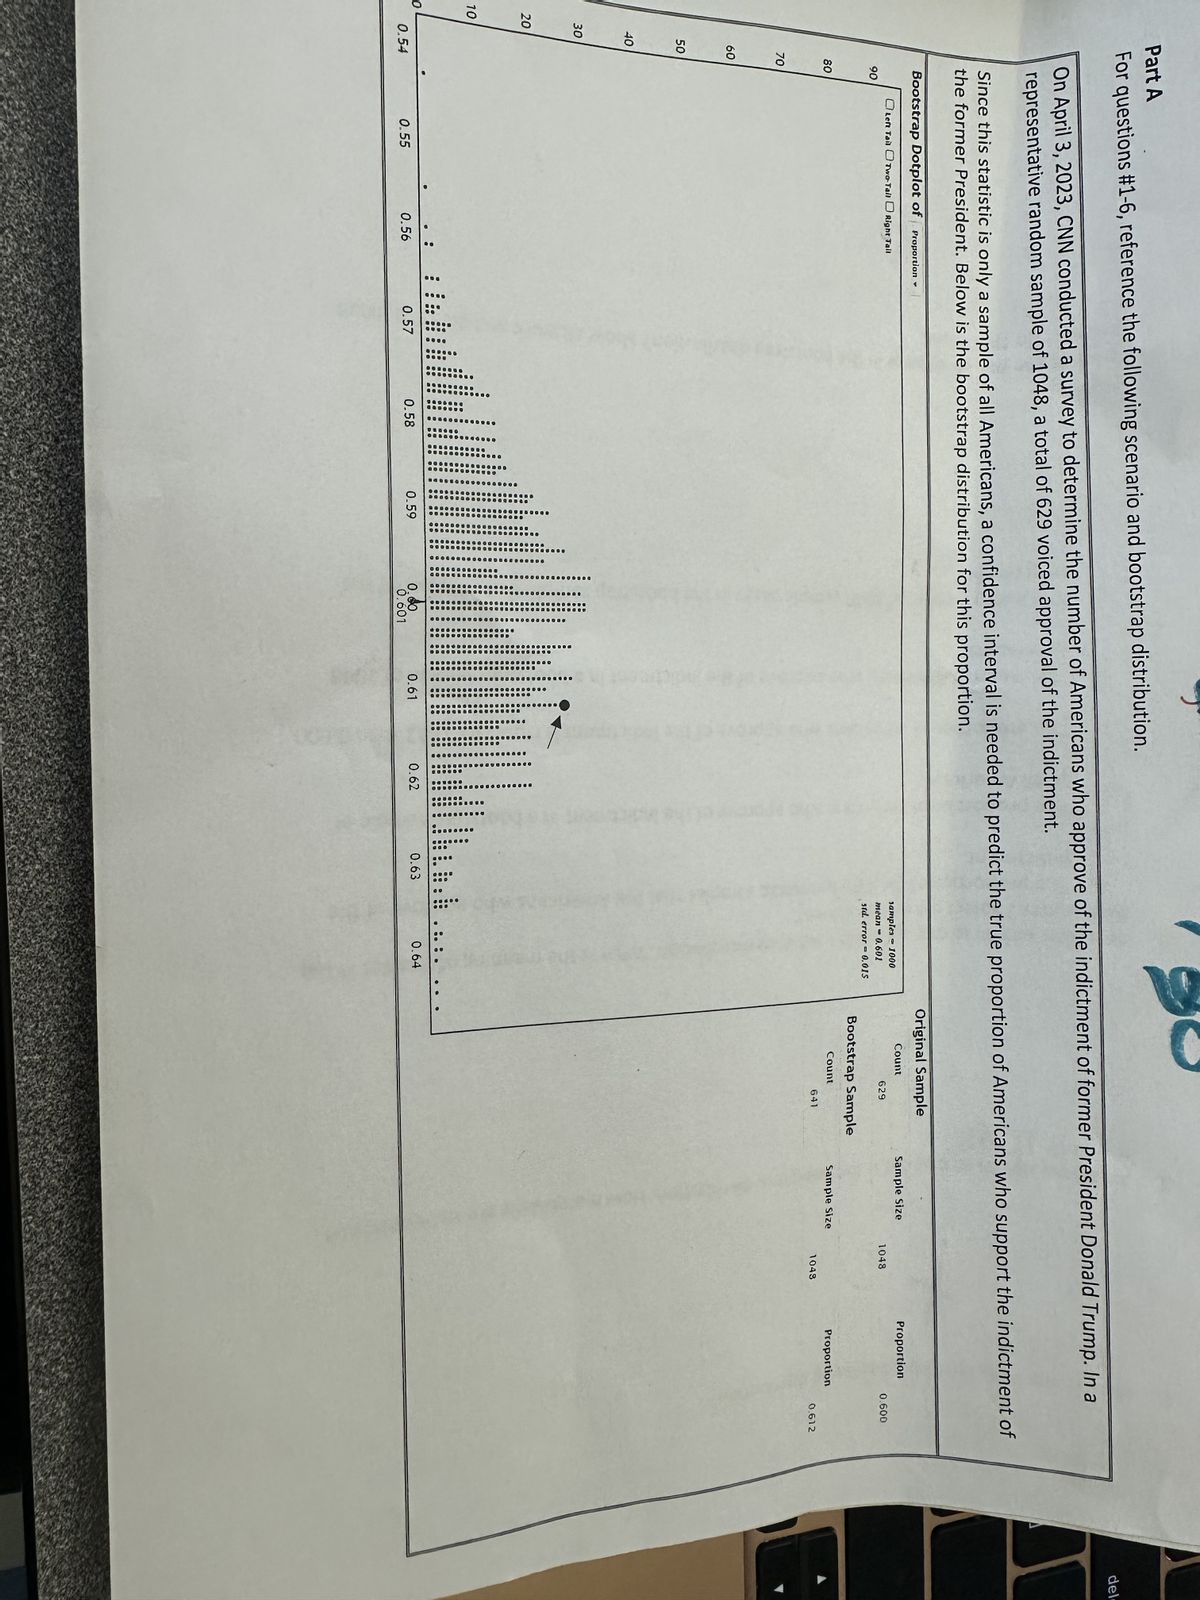
For questions #1-6, reference the following scenario and bootstrap distribution.
40
60
50
On April 3, 2023, CNN conducted a survey to determine the number of Americans who approve of the indictment of former President Donald Trump. In a
representative random sample of 1048, a total of 629 voiced approval of the indictment.
70
0.54
Since this statistic is only a sample of all Americans, a confidence interval is needed to predict the true proportion of Americans who support the indictment of
the former President. Below is the bootstrap distribution for this proportion.
Bootstrap Dotplot of
90
80
Proportion
Left Tail OTwo-Tail O Right Tail
0.55
0.56
DOD
0.57
PO O DO
0.58
COU
CO DO
0 00
0.59
BUDD
OD D
2009
0.00
0.601
DO
c
0.9
.. OD
00
00 DD DD . .
00
0.61
0.62
00
BO
Go
0.63
samples - 1000
mean 0.601
std. error = 0.015
0.64
Original Sample
Count
629
Bootstrap Sample
Count
641
Sample Size
Sample Size
1048
1049
Proportion
Proportion
0.600
0.612
del
Expert Solution
This question has been solved!
Explore an expertly crafted, step-by-step solution for a thorough understanding of key concepts.

Step by stepSolved in 3 steps

Knowledge Booster

Similar questions
- 2. An experiment showed that 52 teenage subjects dreamed in black and white & 175 of them dreamed in colors. Another study on old-age adults showed that 5 dreamed in black and white & 40 of them dreamed in colors. Find the 95% confidence interval for the difference between the rates who dreamed in black and white and those in colors. please show how to solve it. no excel please.arrow_forwardWe survey 1004 teens age 13-19, we record whether or not they have had sex education. 817 respond that they have had some form of sex education. (a) Construct a 99% confidence interval for teens who have not had sex education. (b) How many teens would we have to sample in order to cut the margin of error in half?arrow_forwardIf the confidence level is increased, the margin of error decreases. True or Falsearrow_forward
- Report an appropriate hypothesis test for a positive linear relationship and use a 5% significance level. Explain the potential error in words, in context. In the answer options below I have used the phrase “a certain relationship” because I don’t want to give away exactly what type of relationship it is. Group of answer choices We would be accepting that there was a certain relationship between Sale amount and Tip when actually there wasn’t. We would not be accepting that there was a certain relationship between Sale amount and Tip when indeed there wasn’t. We would not be accepting that there was a certain relationship between Sale amount and Tip when actually there was. We would be accepting that there was a certain relationship between Sale amount and Tip when indeed there was.arrow_forwardDescribe three important properties of confidence intervals.arrow_forwardIn a survey of 2567 adults, 1431 say they have started paying bills online in the last year. Construct a 99% confidence interval for the population proportion. Interpret the results.arrow_forward
- Explain what happens when finding the margin of error if all stays the sameexcept that the confidence interval increases.arrow_forwarda critic points out that this 95 % confidence interval is only accurate if the statistic follows a normal distrubution , or if the normal model is a good approximation. is this true for this data? explainarrow_forwardIf the confidence interval would only contain positive values, what would be your interpretation of this 95% confidence interval regarding this diet program?arrow_forward
arrow_back_ios
arrow_forward_ios
Recommended textbooks for you
- MATLAB: An Introduction with ApplicationsStatisticsISBN:9781119256830Author:Amos GilatPublisher:John Wiley & Sons Inc
 Probability and Statistics for Engineering and th...StatisticsISBN:9781305251809Author:Jay L. DevorePublisher:Cengage Learning
 Statistics for The Behavioral Sciences (MindTap C...StatisticsISBN:9781305504912Author:Frederick J Gravetter, Larry B. WallnauPublisher:Cengage Learning
  Elementary Statistics: Picturing the World (7th E...StatisticsISBN:9780134683416Author:Ron Larson, Betsy FarberPublisher:PEARSON
 The Basic Practice of StatisticsStatisticsISBN:9781319042578Author:David S. Moore, William I. Notz, Michael A. FlignerPublisher:W. H. Freeman
 Introduction to the Practice of StatisticsStatisticsISBN:9781319013387Author:David S. Moore, George P. McCabe, Bruce A. CraigPublisher:W. H. Freeman
MATLAB: An Introduction with Applications
Statistics
ISBN:9781119256830
Author:Amos Gilat
Publisher:John Wiley & Sons Inc
Probability and Statistics for Engineering and th...
Statistics
ISBN:9781305251809
Author:Jay L. Devore
Publisher:Cengage Learning
Statistics for The Behavioral Sciences (MindTap C...
Statistics
ISBN:9781305504912
Author:Frederick J Gravetter, Larry B. Wallnau
Publisher:Cengage Learning
Elementary Statistics: Picturing the World (7th E...
Statistics
ISBN:9780134683416
Author:Ron Larson, Betsy Farber
Publisher:PEARSON
The Basic Practice of Statistics
Statistics
ISBN:9781319042578
Author:David S. Moore, William I. Notz, Michael A. Fligner
Publisher:W. H. Freeman
Introduction to the Practice of Statistics
Statistics
ISBN:9781319013387
Author:David S. Moore, George P. McCabe, Bruce A. Craig
Publisher:W. H. Freeman