
MATLAB: An Introduction with Applications
6th Edition
ISBN: 9781119256830
Author: Amos Gilat
Publisher: John Wiley & Sons Inc
expand_more
expand_more
format_list_bulleted
Related questions
Question
thumb_up100%
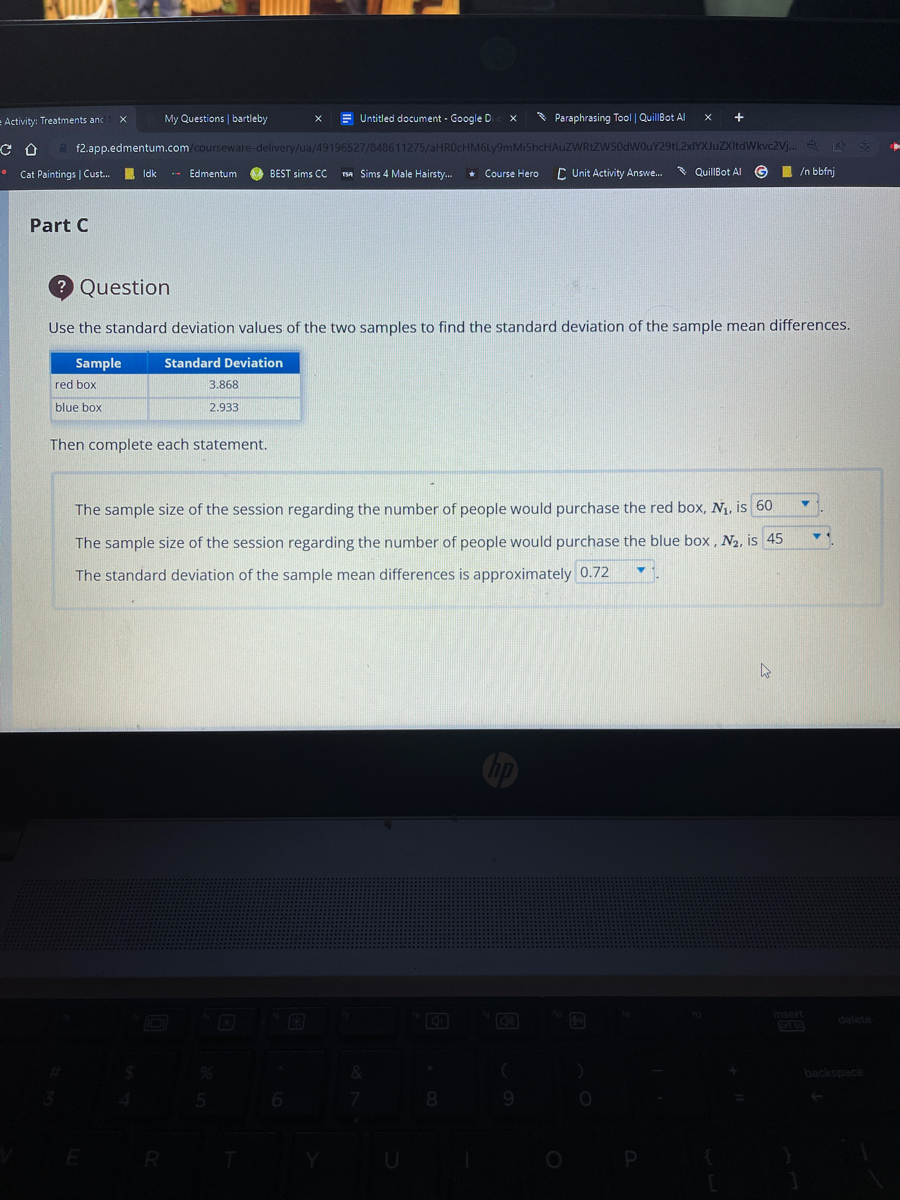
Use the standard deviation values of the two samples to find the standard deviation of the sample mean differences.
Sample Standard deviation 
Red box 3.868
Blue box 2.933
Then complete each statement
By the way
60, 45 and 0.72 are wrong
Options for Red box is 45 48 63 (60 is wrong)
Options for blue box is 48 60 63 (45 is wrong)
Options for sample mean differences 0.63 0.69 0.43 (0.72 is wrong)

Transcribed Image Text:My Questions | bartleby
E Untitled document - Google D
* Paraphrasing Tool | QuillBot Al
+
= Activity: Treatments anc
f2.app.edmentum.com/courseware-delivery/ua/49196527/848611275/aHROcHM6Ly9mMi5hcHAuZWRIZW50dWouY29tL2xIYXJuZXItdWkvc2Vj. E
TSA Sims 4 Male Hairsty.
* Course Hero
C Unit Activity Answe.
* QuillBot Al
I /n bbfnj
Cat Paintings | Cust..
Idk
Edmentum
BEST sims CC
Part C
Question
Use the standard deviation values of the two samples to find the standard deviation of the sample mean differences.
Sample
Standard Deviation
red box
3.868
blue box
2.933
Then complete each statement.
The sample size of the session regarding the number of people would purchase the red box, N1, is 60
The sample size of the session regarding the number of people would purchase the blue box , N2, is 45
The standard deviation of the sample mean differences is approximately 0.72
delete
backspace

Transcribed Image Text:My Questions | bartleby
E Untitled document - Google D
* Paraphrasing Tool | QuillBot Al
Activity: Treatments anc
f2.app.edmentum.com/courseware-delivery/ua/49196527/848611275/aHROcHM6Ly9mMi5hcHAuZWRIZW50dWouY29tL2xIYXJuZXItdWkvc2V. R
Cat Paintings | Cust.
-- Edmentum
BEST sims CC
TSA Sims 4 Male Hairsty.
* Course Hero
C Unit Activity Answe.
* QuillBot Al
G
I /n bbfnj
Idk
14 of 19
E Save & Exit
Course Activity: Treatments and Significance
Task 3
A Print
Sample Mean Differences and Standard Deviation
As a member of the marketing team for a pasta manufacturer, you want to find out whether there's any difference in the
mean number of people who would buy the new macaroni product, L-Bow Roni, if it had a red box and if it had a blue box.
In each session, you bring in 30 people to try L-Bow Roni and have them respond with whether they would buy this product
over the competitor's product. Suppose you conducted 45 sessions with the red box and 60 sessions with the blue box. This
data sheet e gives you the number of yes responses to the survey for each session. Note that the two samples are different
sizes.
To determine whether this difference is significant, you need to find the standard deviation of the sample mean differences.
For this task, you'll use this formula for the standard deviation of sample mean differences.
OM - OM, = V
In this formula, the subscripts M,and Marepresent the means of the two samples, oand ozare the standard deviations of the
two populations, and nyand nzare the sample sizes.
Part A
? Question
insert
delete
home
backspace
8.
9.
enter
Expert Solution
This question has been solved!
Explore an expertly crafted, step-by-step solution for a thorough understanding of key concepts.

This is a popular solution

Trending nowThis is a popular solution!

Step by stepSolved in 2 steps

Knowledge Booster

Similar questions
- The standard deviation of the given the data (14, 13, 16, 9, 3} is ♦ If the average American male is 5'10" and the standard deviation is 3", then Yao Ming who is 7'6" is within ◆ standard deviations of the mean? An outlier is an extreme value that is significantly less or more than the rest of the data. In the data below take out the outlier, then calculate using a statistics calculator or spreadsheet, the standard deviation of the heights of 15 soda cans. {92.8, 92.8, 92.9, 92.9, 92.9, 92.8, 92.7, 92.9, 92.1, 92.7, 92.8, 92.9, 92.9, 92.7, 92.8} Round to the nearest 100th. Answer:arrow_forwardPlayer His Average Points Other's Average Points Other's Standard Deviation Fredo 153 163 15 Karl 163 183 35 Table 2.57 a. Which player had the higher average points when compared to the other players on his team? Fredo O Karl b. Use Table 2.57 to find the value that is three standard deviations above the mean for each team. Enter the exact answers. Fredo's team: Number Karl's team: Number C. Use Table 2.57 to find the value that is three standard deviations below the mean for each team. Enter the exact answers. Fredo's team: Number Karl's team: Number Next Back Question Menu- Quit & Save Submit Assignment 502 PM 200arrow_forwardThe numbers of regular season wins for 10 football teams in a given season are given below. Determine the range, mean, variance, and standard deviation of the population data set. 2, 7, 15, 5, 14, 10, 12, 8, 3, 9 The range is 1313. (Simplify your answer.) The population mean is . (Simplify your answer. Round to the nearest tenth as needed.) The population variance is nothing. (Simplify your answer. Round to the nearest tenth as needed.) The population standard deviation is nothing. (Simplify your answer. Round to the nearest tenth as needed.)arrow_forward
- Please find the range, sample standard deviation and inter-quartile range (IQR) of the following data set. 25 37 39 56 61 71 73 73 80 85 range = (Please enter an exact answer.) standard deviation (ss) = (Please show your answer to one decimal place.) IQR = (Please enter an exact answer.)A new number, 180, is added to the data set above. Please find the new range, sample standard deviation and IQR of the new data set.range = (Please enter an exact answer.) standard deviation = (Please show your answer to one decimal place.) IQR = (Please enter an exact answer.)Which measure of spread is less affected by the addition of the extreme observation? Range standard deviation IQRarrow_forward← The numbers of regular season wins for 10 football teams in a given season are given below. Determine the range, mean, variance, and standard deviation of the population data set. 2, 10, 15, 4, 12, 9, 13, 10, 5, 7 The range is 13. (Simplify your answer.) The population mean is 8.7. (Simplify your answer. Round to the nearest tenth as needed.) The population variance is 15.6. (Simplify your answer. Round to the nearest tenth as needed.) The population standard deviation is (Simplify your answer. Round to the nearest tenth as needed.)arrow_forwardEnglish Philippines) e to search Given Samples A and B below, Sample A: Sample B: Sample A: - 3.2 4.6 Sample B: - a. Calculate the mean and standard deviation for each sample. 2.1 2.6 Sample B: CV- 0.00 0.00 4.5 4.5 2.0 3.2 3.6 2.8 SA 0.00 96 50 11 b. Calculate the coefficient of variation for each sample. Sample A: CV. - 0.00 % E Round to two decimal places if necessari c. Which sample is more variable? 0.00 0.00 2.6 3.1 Sample A Sample B Neither sample is more variable than the other 3.8 4.1 3.8 4.9 3.5 4.6 land Iarrow_forward
- I need range, variance, and standard deviation please with step by step so I can learn.arrow_forwardThe range is (Simplify your answer.) The population mean is (Simplify your answer. Round to the nearest tenth as needed.) The population variance is (Simplify your answer. Round to the nearest tenth as needed.) The population standard deviation is (Simplify your answer. Round to the nearest tenth as needed.)arrow_forwardThe data in the table is points scored by a basketball team in a certain period of time. Use the data in the table to answer the bulleted statements.arrow_forward
- Find the variance and the standard deviation (correct to two decimal places). 78, 89, 94, 94, 95 variance standard deviationarrow_forwardThe goal of the one-sample t-test is to: Group of answer choices describe the location of a score within a distribution compare the mean of a sample to the population mean. compare the means of two samples. compare the standard deviation of a sample to the standard deviation of the population.arrow_forwardWhich of the two samples in each set has the higher standard deviation. Answer this question by looking at the data without any computation. Explain your reasoning for each answer. Set 1 – Sample A: 16, 16, 16, 16, 16 – Sample B: 20, 20, 20, 20, 20 Set 2 – Sample A: 16, 16, 16, 16, 16 – Sample B: 15, 16, 16, 16, 16 Set 3 – Sample A: 20, 25, 25, 25, 30 – Sample B: 15, 25, 25, 25, 35 Set 4 – Sample A: 20, 20, 30, 40, 40 – Sample B: 20, 25, 30, 35, 40arrow_forward
arrow_back_ios
arrow_forward_ios
Recommended textbooks for you
- MATLAB: An Introduction with ApplicationsStatisticsISBN:9781119256830Author:Amos GilatPublisher:John Wiley & Sons Inc
 Probability and Statistics for Engineering and th...StatisticsISBN:9781305251809Author:Jay L. DevorePublisher:Cengage Learning
 Statistics for The Behavioral Sciences (MindTap C...StatisticsISBN:9781305504912Author:Frederick J Gravetter, Larry B. WallnauPublisher:Cengage Learning
  Elementary Statistics: Picturing the World (7th E...StatisticsISBN:9780134683416Author:Ron Larson, Betsy FarberPublisher:PEARSON
 The Basic Practice of StatisticsStatisticsISBN:9781319042578Author:David S. Moore, William I. Notz, Michael A. FlignerPublisher:W. H. Freeman
 Introduction to the Practice of StatisticsStatisticsISBN:9781319013387Author:David S. Moore, George P. McCabe, Bruce A. CraigPublisher:W. H. Freeman
MATLAB: An Introduction with Applications
Statistics
ISBN:9781119256830
Author:Amos Gilat
Publisher:John Wiley & Sons Inc
Probability and Statistics for Engineering and th...
Statistics
ISBN:9781305251809
Author:Jay L. Devore
Publisher:Cengage Learning
Statistics for The Behavioral Sciences (MindTap C...
Statistics
ISBN:9781305504912
Author:Frederick J Gravetter, Larry B. Wallnau
Publisher:Cengage Learning
Elementary Statistics: Picturing the World (7th E...
Statistics
ISBN:9780134683416
Author:Ron Larson, Betsy Farber
Publisher:PEARSON
The Basic Practice of Statistics
Statistics
ISBN:9781319042578
Author:David S. Moore, William I. Notz, Michael A. Fligner
Publisher:W. H. Freeman
Introduction to the Practice of Statistics
Statistics
ISBN:9781319013387
Author:David S. Moore, George P. McCabe, Bruce A. Craig
Publisher:W. H. Freeman