
MATLAB: An Introduction with Applications
6th Edition
ISBN: 9781119256830
Author: Amos Gilat
Publisher: John Wiley & Sons Inc
expand_more
expand_more
format_list_bulleted
Related questions
Concept explainers
Topic Video
Question
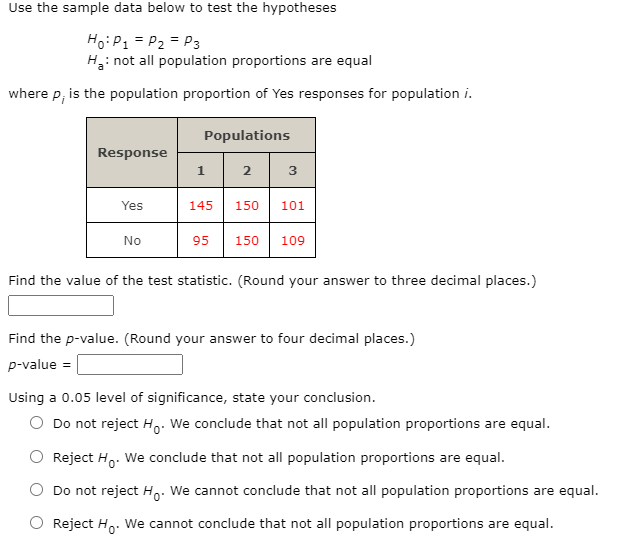

Transcribed Image Text:Use the sample data below to test the hypotheses
Ho:P1 = P2 = P3
Hin
: not all population proportions are equal
where p, is the population proportion of Yes responses for population i.
Populations
Response
3
Yes
145
150
101
No
95
150
109
Find the value of the test statistic. (Round your answer to three decimal places.)
Find the p-value. (Round your answer to four decimal places.)
p-value =
Using a 0.05 level of significance, state your conclusion.
Do not reject H,. We conclude that not all population proportions are equal.
O Reject H,. We conclude that not all population proportions are equal.
Do not reject H,. We cannot conclude that not all population proportions are equal.
O Reject Ho. We cannot conclude that not all population proportions are equal.
Expert Solution
This question has been solved!
Explore an expertly crafted, step-by-step solution for a thorough understanding of key concepts.

This is a popular solution

Trending nowThis is a popular solution!

Step by stepSolved in 3 steps with 3 images

Knowledge Booster


Learn more about
Need a deep-dive on the concept behind this application? Look no further. Learn more about this topic, statistics and related others by exploring similar questions and additional content below.Similar questions
- A publisher reports that 61 % of their readers own a particular make of car. A marketing executive wants to test the claim that the percentage is actually different from the reported percentage. A random sample of 320 found that 55 % of the readers owned a particular make of car. Determine the P-value of the test statistic. Round your answer to four decimal places. Answer How to enter your answer (opens in new window) Tables Keypad Keyboard Shortcutsarrow_forwardClaim: Fewer than 93% of adults have a cell phone. In a reputable poll of 1041 adults, 88% said that they have a cell phone. Find the value of the test statistic. Question content area bottom Part 1 The value of the test statistic is enter your response here. (Round to two decimal places as needed.)arrow_forwardUse the random numbers. Thank you.arrow_forward
- In a random sample of seven people, the mean driving distance to work was 22.5 miles and the standard deviation was 5.9 miles. Assume the population is normally distributed and use the t-distribution to find the margin of error and construct a 95% confidence interval for the population mean u. Interpret the results. Identify the margin of error. (Round to one decimal place as needed.) Construct a 95% confidence interval for the population mean. (Round to one decimal place as needed.) Interpret the results. Select the correct choice below and fill in the answer box to complete your choice. (Type an integer or a decimal. Do not round.) O A. With % confidence, it can be said that most driving distances to work (in miles) in the population are between the interval's endpoints. O B. It can be said that % of the population has a driving distance to work (in miles) that is between the interval's endpoints. OC. With % confidence, it can be said that the population mean driving distance to work…arrow_forwardCarmen and Rosanna are two employees in an electronics store. The store manager has put an emphasis on increasing the number of applications for the store credit card. The manager randomly selected 24 weeks for each employee and recorded the number of completed applications for each week, which is provided in the samples below. Each employee completed 21 applications in one of the weeks selected. Use Excel to calculate each employee's z-score for completing 21 applications. Round your answers to two decimal places. Carmen Rosanna11 56 1115 613 185 1114 1416 521 208 1110 97 1416 1513 1310 619 2118 95 1817 310 126 1712 1214 419 1017 8arrow_forwardn, where k is the percentile and n is the sample size. Given a sorted sample of 234 IQ scores, what is the value of the 40th percentile? 100 When finding the value of a percentile, the location of that value is L = Choose the correct answer below. O A. The 93rd IQ score in the sorted list O B. The 40th IQ score in the sorted list. O C. The 94th IQ score in the sorted list O D. The IQ score midway between the 40th and 41st scores in the sorted list.arrow_forward
- Hi could you answer whats blank?arrow_forwardTo study the effect of temperature on yield in a chemical process, five batches were produced at each of three temperature levels. The results follow. Source of Variation 50°C 60°C 70°C Error 35 Total 23 Temperature 35 38 34 Treatments 70 29 368 31 438 35 23 22 Construct an analysis of variance table. (Round your values for MSE and F to two decimal places, and your p-value to four decimal places.) 24 27 27 29 Sum of Squares 38 2 Degrees of Freedom 11 X X 35 Mean Square 18.83 X F p-value Use a 0.05 level of significance to test whether the temperature level has an effect on the mean yield of the process.arrow_forwardPlease Answer f and g Please provide typed answer. ONLY TYPED ANSWERSarrow_forward
- Options: 10 97 68 385arrow_forwardThe International League of Triple-A minor league baseball consists of 14 teams organized into three divisions: North, South, and West. Suppose the following data show the average attendance for the 14 teams in the International League. Also shown are the teams' records; W denotes the number of games won, L denotes the number of games lost, and PCT is the proportion of games played that were won. Team Name Division w L PCT Attendance Buffalo Bisons North 66 77 0.462 8,811 Lehigh Valley IronPigs North 55 89 0.382 8,473 Pawtucket Red Sox North 85 58 0.594 9,098 Rochester Red Wings North 74 70 0.514 6,911 Scranton-Wilkes Barre Yankees North 88 56 0.611 7,145 Syracuse Chiefs North 69 73 0.486 5,764 Charlotte Knights South 63 78 0.447 4,522 Durham Bulls South 74 70 0.514 6,997 Norfolk Tides South 64 78 0.451 6,288 Richmond Braves South 63 78 0.447 4,456 Columbus Clippers West 69 73 0.486 7,796 Indianapolis Indians West 68 76 0.472 8,537 Louisville Bats West 88 56 0.611 9,157 Toledo Mud Hens…arrow_forwardind the number of successes x suggested by the given statement: From a CNN/USA Today/Gallup poll: Among 1299 survey subjects, 13.7 % say that the opinion of a celebrity would influence their own opinion. x = nothing (round off to a whole number)arrow_forward
arrow_back_ios
arrow_forward_ios
Recommended textbooks for you
- MATLAB: An Introduction with ApplicationsStatisticsISBN:9781119256830Author:Amos GilatPublisher:John Wiley & Sons Inc
 Probability and Statistics for Engineering and th...StatisticsISBN:9781305251809Author:Jay L. DevorePublisher:Cengage Learning
 Statistics for The Behavioral Sciences (MindTap C...StatisticsISBN:9781305504912Author:Frederick J Gravetter, Larry B. WallnauPublisher:Cengage Learning
  Elementary Statistics: Picturing the World (7th E...StatisticsISBN:9780134683416Author:Ron Larson, Betsy FarberPublisher:PEARSON
 The Basic Practice of StatisticsStatisticsISBN:9781319042578Author:David S. Moore, William I. Notz, Michael A. FlignerPublisher:W. H. Freeman
 Introduction to the Practice of StatisticsStatisticsISBN:9781319013387Author:David S. Moore, George P. McCabe, Bruce A. CraigPublisher:W. H. Freeman
MATLAB: An Introduction with Applications
Statistics
ISBN:9781119256830
Author:Amos Gilat
Publisher:John Wiley & Sons Inc
Probability and Statistics for Engineering and th...
Statistics
ISBN:9781305251809
Author:Jay L. Devore
Publisher:Cengage Learning
Statistics for The Behavioral Sciences (MindTap C...
Statistics
ISBN:9781305504912
Author:Frederick J Gravetter, Larry B. Wallnau
Publisher:Cengage Learning
Elementary Statistics: Picturing the World (7th E...
Statistics
ISBN:9780134683416
Author:Ron Larson, Betsy Farber
Publisher:PEARSON
The Basic Practice of Statistics
Statistics
ISBN:9781319042578
Author:David S. Moore, William I. Notz, Michael A. Fligner
Publisher:W. H. Freeman
Introduction to the Practice of Statistics
Statistics
ISBN:9781319013387
Author:David S. Moore, George P. McCabe, Bruce A. Craig
Publisher:W. H. Freeman