MATLAB: An Introduction with Applications
6th Edition
ISBN: 9781119256830
Author: Amos Gilat
Publisher: John Wiley & Sons Inc
expand_more
expand_more
format_list_bulleted
Concept explainers
Topic Video
Question

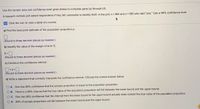
Transcribed Image Text:Use the sample data and confidence level given below to complete parts (a) through (d).
A research institute poll asked respondents if they felt vulnerable to identity theft. In the poll, n = 994 and x = 565 who said "yes." Use a 99% confidence level.
Click the icon to view a table of z scores.
a) Find the best point estimate of the population proportion p.
(Round to three decimal places as needed.)
b) Identify the value of the margin of error E.
E =
(Round to three decimal places as needed.)
c) Construct the confidence interval.
<p<
(Round to three decimal places as needed.)
d) Write a statement that correctly interprets the confidence interval. Choose the correct answer below.
O A. One has 99% confidence that the sample proportion is equal to the population proportion.
B. There is a 99% chance that the true value of the population proportion will fall between the lower bound and the upper bound.
C. One has 99% confidence that the interval from the lower bound to the upper bound actually does contain the true value of the population proportion.
D. 99% of sample proportions will fall between the lower bound and the upper bound.
worlo)
Expert Solution
This question has been solved!
Explore an expertly crafted, step-by-step solution for a thorough understanding of key concepts.
This is a popular solution
Trending nowThis is a popular solution!
Step by stepSolved in 3 steps

Knowledge Booster
Learn more about
Need a deep-dive on the concept behind this application? Look no further. Learn more about this topic, statistics and related others by exploring similar questions and additional content below.Similar questions
- If the proportion of Heads is .25 out of 200 flips, what is the p-value? Round to three places.arrow_forwardI can't understand why the data is the percentage of surveyed parents.arrow_forwardConsider the data set: 7 8 4 2 1 3 9 3 Find the mean: (Round your answer to 3 decimal places if necessary) Find the median: (Round your answer to 3 decimal places if necessary)arrow_forward
- Given the data set: 6, 19, 17, 23, 20, 10. Determine (i). the percentile rank for each test score,arrow_forwardq25- Using percentiles, the difference between which of the following is the interquartile range? Select one: a. 10% and 90% values. b. 25% and 75% values. c. 30% and 70% values. d. 15% and 85% values.arrow_forwardIn a scatter diagram of the data of 50 participants, how many points are plotted? A. 5 B. 25 C. 50 D. 100arrow_forward
- Help, please.arrow_forwardGiven the 1st and 3rd quartiles of a data are 24 and 48, respectively, what value would be considered an outlier? A 83 B D 88 72 Can't tell.arrow_forwardFor each problem, you must state the hypotheses, calculate the test statistic, and explain your decision. The following table reports the relationship between class standing and political orientation for a random sample of 267 college students. a. The table is constructed assuming that class standing is the independent variable. Please add %s in the appropriate position (columns or rows) to describe the pattern of the relationship. b. Is there a statistically significant relationship between these variables?arrow_forward
- . How high are the levels for the highest (top) 4.8% of all children? Z- score = Answer =arrow_forwardK The accompanying data represent the wait time (in minutes) for a random sample of 40 visitors to a popular attraction in a large amusement park. Use the sample data to complete parts (a) through (d). Click the icon to view the data for wait times. Wait times 7 6454256200 15 32 23 8 . 9 44 10 9 33 55 1 27 6 9 6 Print 22 7 23 10 25 25 16 54 3 9 32 Done *** 0 3 6 12 5 3 7 8 13 7 16 C - Xarrow_forward
arrow_back_ios
arrow_forward_ios
Recommended textbooks for you
 MATLAB: An Introduction with ApplicationsStatisticsISBN:9781119256830Author:Amos GilatPublisher:John Wiley & Sons Inc
 Probability and Statistics for Engineering and th...StatisticsISBN:9781305251809Author:Jay L. DevorePublisher:Cengage Learning
 Statistics for The Behavioral Sciences (MindTap C...StatisticsISBN:9781305504912Author:Frederick J Gravetter, Larry B. WallnauPublisher:Cengage Learning
 Elementary Statistics: Picturing the World (7th E...StatisticsISBN:9780134683416Author:Ron Larson, Betsy FarberPublisher:PEARSON
 The Basic Practice of StatisticsStatisticsISBN:9781319042578Author:David S. Moore, William I. Notz, Michael A. FlignerPublisher:W. H. Freeman
 Introduction to the Practice of StatisticsStatisticsISBN:9781319013387Author:David S. Moore, George P. McCabe, Bruce A. CraigPublisher:W. H. Freeman

MATLAB: An Introduction with Applications
Statistics
ISBN:9781119256830
Author:Amos Gilat
Publisher:John Wiley & Sons Inc

Probability and Statistics for Engineering and th...
Statistics
ISBN:9781305251809
Author:Jay L. Devore
Publisher:Cengage Learning

Statistics for The Behavioral Sciences (MindTap C...
Statistics
ISBN:9781305504912
Author:Frederick J Gravetter, Larry B. Wallnau
Publisher:Cengage Learning

Elementary Statistics: Picturing the World (7th E...
Statistics
ISBN:9780134683416
Author:Ron Larson, Betsy Farber
Publisher:PEARSON

The Basic Practice of Statistics
Statistics
ISBN:9781319042578
Author:David S. Moore, William I. Notz, Michael A. Fligner
Publisher:W. H. Freeman

Introduction to the Practice of Statistics
Statistics
ISBN:9781319013387
Author:David S. Moore, George P. McCabe, Bruce A. Craig
Publisher:W. H. Freeman