MATLAB: An Introduction with Applications
6th Edition
ISBN: 9781119256830
Author: Amos Gilat
Publisher: John Wiley & Sons Inc
expand_more
expand_more
format_list_bulleted
Concept explainers
Topic Video
Question

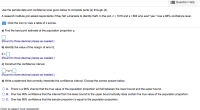
Transcribed Image Text:Use the sample data and confidence level given below to complete parts (a) through (d).
A research institute poll asked respondents if they felt vulnerable to identity theft. In the poll, n= 1018 and x= 600 who said "yes." Use a 95% confidence level.
E Click the icon to view a table of z scores.
a) Find the best point estimate of the population proportion p.
(Round to three decimal places as needed.)
b) Identify the value of the margin of error E.
E=
(Round to three decimal places as needed.)
c) Construct the confidence interval.
D<p<O
(Round to three decimal places as needed.)
d) Write a statement that correctly interprets the confidence interval. Choose the correct answer below.
O A. There is a 95% chance that the true value of the population proportion will fall between the lower bound and the upper bound.
O B. One has 95% confidence that the interval from the lower bound to the upper bound actually does contain the true value of the population proportion.
OC. One has 95% confidence that the sample proportion is equal to the population proportion.
Expert Solution
This question has been solved!
Explore an expertly crafted, step-by-step solution for a thorough understanding of key concepts.
This is a popular solution
Trending nowThis is a popular solution!
Step by stepSolved in 4 steps with 16 images

Knowledge Booster
Learn more about
Need a deep-dive on the concept behind this application? Look no further. Learn more about this topic, statistics and related others by exploring similar questions and additional content below.Similar questions
- A congressperson wants to come up with a single value to describe the prices of homes in their district. However, their district consists of a few homes that are extremely expensive compared to the others. Which descriptive statistic should they use? a. Range b. Mode c. Median d. Meanarrow_forwardSuppose you send a survey to 500 people and get 233 responses. You then find that 86% of the responses prefer Coke instead of Pepsi Is the above 86% a parameter or statistic? a. parameter b. statisticarrow_forwardBelow are the heights (in inches) of a sample of football players. Graph the boxplot and find the values for each of the quartiles and outlier(s), if they exist. (10 points for total) Students use the data below to calculate: 85 83 79 55 70 775 89 76 28. Smallest value= Q1= Q2= Q3= Largest value= 87 88 88 85 86 Outlier(s) Draw the Boxplot inside the box and label all values:arrow_forward
- Help, please.arrow_forwardThe median for the set of sample measurement { -10,-8,-4,-2,0,6,11} a. -2 b. -1 c. 0 d. 6arrow_forwardFor each problem, you must state the hypotheses, calculate the test statistic, and explain your decision. The following table reports the relationship between class standing and political orientation for a random sample of 267 college students. a. The table is constructed assuming that class standing is the independent variable. Please add %s in the appropriate position (columns or rows) to describe the pattern of the relationship. b. Is there a statistically significant relationship between these variables?arrow_forward
- A class of students took a test. The instructor said that the 75th percentile score was 90 out of 100. What does this mean? A. 90% of the students scored 75 or more on the test. B. 75% of the students scored 90 or more on the test. C. 25% of the students scored 90 or more on the test. D. The high score in the class was (.75)(90).arrow_forwardDetermine whether the data set described below is a population or a sample. Explain your reasoning. A survey of 100 randomly selected students at Keller Graduate School of Management that found 15% of the students traveled more than 10 miles to get to campusarrow_forwardPlease help find the tstat. Thanks.arrow_forward
arrow_back_ios
arrow_forward_ios
Recommended textbooks for you
 MATLAB: An Introduction with ApplicationsStatisticsISBN:9781119256830Author:Amos GilatPublisher:John Wiley & Sons Inc
 Probability and Statistics for Engineering and th...StatisticsISBN:9781305251809Author:Jay L. DevorePublisher:Cengage Learning
 Statistics for The Behavioral Sciences (MindTap C...StatisticsISBN:9781305504912Author:Frederick J Gravetter, Larry B. WallnauPublisher:Cengage Learning
 Elementary Statistics: Picturing the World (7th E...StatisticsISBN:9780134683416Author:Ron Larson, Betsy FarberPublisher:PEARSON
 The Basic Practice of StatisticsStatisticsISBN:9781319042578Author:David S. Moore, William I. Notz, Michael A. FlignerPublisher:W. H. Freeman
 Introduction to the Practice of StatisticsStatisticsISBN:9781319013387Author:David S. Moore, George P. McCabe, Bruce A. CraigPublisher:W. H. Freeman

MATLAB: An Introduction with Applications
Statistics
ISBN:9781119256830
Author:Amos Gilat
Publisher:John Wiley & Sons Inc

Probability and Statistics for Engineering and th...
Statistics
ISBN:9781305251809
Author:Jay L. Devore
Publisher:Cengage Learning

Statistics for The Behavioral Sciences (MindTap C...
Statistics
ISBN:9781305504912
Author:Frederick J Gravetter, Larry B. Wallnau
Publisher:Cengage Learning

Elementary Statistics: Picturing the World (7th E...
Statistics
ISBN:9780134683416
Author:Ron Larson, Betsy Farber
Publisher:PEARSON

The Basic Practice of Statistics
Statistics
ISBN:9781319042578
Author:David S. Moore, William I. Notz, Michael A. Fligner
Publisher:W. H. Freeman

Introduction to the Practice of Statistics
Statistics
ISBN:9781319013387
Author:David S. Moore, George P. McCabe, Bruce A. Craig
Publisher:W. H. Freeman