
MATLAB: An Introduction with Applications
6th Edition
ISBN: 9781119256830
Author: Amos Gilat
Publisher: John Wiley & Sons Inc
expand_more
expand_more
format_list_bulleted
Related questions
Question
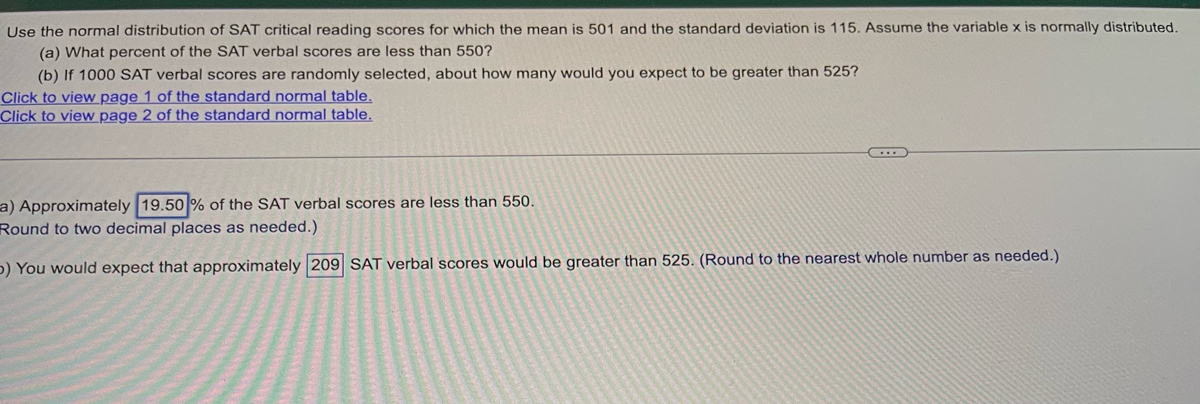

Transcribed Image Text:Use the normal distribution of SAT critical reading scores for which the mean is 501 and the standard deviation is 115. Assume the variable x is normally distributed.
(a) What percent of the SAT verbal scores are less than 550?
(b) If 1000 SAT verbal scores are randomly selected, about how many would you expect to be greater than 525?
Click to view page 1 of the standard normal table.
Click to view page 2 of the standard normal table.
a) Approximately 19.50% of the SAT verbal scores are less than 550.
Round to two decimal places as needed.)
D) You would expect that approximately 209 SAT verbal scores would be greater than 525. (Round to the nearest whole number as needed.)
Expert Solution
This question has been solved!
Explore an expertly crafted, step-by-step solution for a thorough understanding of key concepts.

This is a popular solution

Trending nowThis is a popular solution!

Step by stepSolved in 2 steps

Knowledge Booster

Similar questions
- The average age of class is 22.3 years. The standard deviation is 4.7 years. If the variable is normally distributed, find the age that corresponds to the 94th percentile. SHOW WORK HOW YOU GOT THATarrow_forwardUse z scores to compare the given values. In a recent awards ceremony, the age of the winner for best actor was 34 and the age of the winner for best actress was 43. For all best actors, the mean age is 42.5 years and the standard deviation is 6.2 years. For all best actresses, the mean age is 31.9 years and the standard deviation is 11.2 years. (All ages are determined at the time of the awards ceremony.) Relative to their genders, who had the more extreme age when winning the award, the actor or the actress? Explain. Question content area bottom Part 1 Since the z score for the actor is z=enter your response here and the z score for the actress is z=enter your response here, the ▼ actress actor had the more extreme age. (Round to two decimal places.)arrow_forwardUse z scores to compare the given values. In a recent awards ceremony, the age of the winner for best actor was 33 and the age of the winner for best actress was 47. For all best actors, the mean age is 44.4 years and the standard deviation is 6.5 years. For all best actresses, the mean age is 32.8 years and the standard deviation is 11.2 years. (All ages are determined at the time of the awards ceremony.) Relative to their genders, who had the more extreme age when winning the award, the actor or the actress? Explain. Since the z score for the actor is z= and the z score for the actress is z = the V had the more extreme age. (Round to two decimal places.)arrow_forward
- The lifespans of lizards in particular zoo are normally distributed. The average lizard lives 3.1 yearsthe standard deviation is 0.6 years. Find the probability that the lizards live longer than 3.1 years or less than 2.5 yearsHint: Draw and label a normal curve and use the percentages of the standard deviations. Write your answer using only numbers and do not include units. For example 95.3% would be entered as 95.3arrow_forwardExplain the statistics measure standard deviation. Provide the formulas used to calculate the standard deviation of a sample and of a population. Explain the difference between sample and population.arrow_forwardFind the indicated IQ score. The graph to the right depicts IQ scores of adults, and those scores are normally distributed with a mean of 100 and a standard deviation of 15.arrow_forward
- Find SAT Quartiles. SAT scores are reported on a scale from 600 to 2400. The mean is 1498 and the standard deviation is 316. The quartiles of any distribution are the values with cumulative proportions 0.25, and 0.75. What are the quartiles of the distribution of SAT scores?arrow_forwardThe distribution of heights in a population of women is approximately normal. Sixteen percent of the women have heights less than 62 inches. About 97.5% of the women have heights less than 71 inches. Use the empirical rule to estimate the mean and standard deviation of the heights in this population. Mean: K inches Standard Deviation: inchesarrow_forwardA successful basketball player has a height of 6 feet 11 inches, or 211 cm. Based on statistics from a data set, his height converts to the z score of 5.17. How many standard deviations is his height above the mean?arrow_forward
- Students in a class took a test whose results were normally distributed. The mean score was an 81 and the standard deviation was 4.5. What score is at the 83rd percentile (round to the nearest whole number.) a.84 b.83 c.85 d.86arrow_forwardThe mean value in a dataset is 100, and the value of one standard deviation is 20. What is the value c a piece of data is 2.5 SDs above the mean? Type your answer...arrow_forwardUse z scores to compare the given values. In a recent awards ceremony, the age of the winner for best actor was 27 and the age of the winner for best actress were 47. For all best actors, the mean age is 42.7 years and the standard deviation is 7.7 years. For all best actresses, the mean age is 32.9 years and the standard deviation is 11.2 years. (All ages are determined at the time of the awards ceremony.) Relative to their genders, who had the more extreme age when winning the award, the actor or the actress? Explain. Since the z score for the actor is z= and the z score for the actress is z=,the▼actress actor had the more extreme age.arrow_forward
arrow_back_ios
SEE MORE QUESTIONS
arrow_forward_ios
Recommended textbooks for you
- MATLAB: An Introduction with ApplicationsStatisticsISBN:9781119256830Author:Amos GilatPublisher:John Wiley & Sons Inc
 Probability and Statistics for Engineering and th...StatisticsISBN:9781305251809Author:Jay L. DevorePublisher:Cengage Learning
 Statistics for The Behavioral Sciences (MindTap C...StatisticsISBN:9781305504912Author:Frederick J Gravetter, Larry B. WallnauPublisher:Cengage Learning
  Elementary Statistics: Picturing the World (7th E...StatisticsISBN:9780134683416Author:Ron Larson, Betsy FarberPublisher:PEARSON
 The Basic Practice of StatisticsStatisticsISBN:9781319042578Author:David S. Moore, William I. Notz, Michael A. FlignerPublisher:W. H. Freeman
 Introduction to the Practice of StatisticsStatisticsISBN:9781319013387Author:David S. Moore, George P. McCabe, Bruce A. CraigPublisher:W. H. Freeman
MATLAB: An Introduction with Applications
Statistics
ISBN:9781119256830
Author:Amos Gilat
Publisher:John Wiley & Sons Inc
Probability and Statistics for Engineering and th...
Statistics
ISBN:9781305251809
Author:Jay L. Devore
Publisher:Cengage Learning
Statistics for The Behavioral Sciences (MindTap C...
Statistics
ISBN:9781305504912
Author:Frederick J Gravetter, Larry B. Wallnau
Publisher:Cengage Learning
Elementary Statistics: Picturing the World (7th E...
Statistics
ISBN:9780134683416
Author:Ron Larson, Betsy Farber
Publisher:PEARSON
The Basic Practice of Statistics
Statistics
ISBN:9781319042578
Author:David S. Moore, William I. Notz, Michael A. Fligner
Publisher:W. H. Freeman
Introduction to the Practice of Statistics
Statistics
ISBN:9781319013387
Author:David S. Moore, George P. McCabe, Bruce A. Craig
Publisher:W. H. Freeman