ENGR.ECONOMIC ANALYSIS
14th Edition
ISBN: 9780190931919
Author: NEWNAN
Publisher: Oxford University Press
expand_more
expand_more
format_list_bulleted
Question

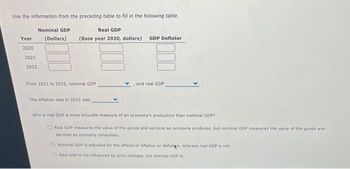
Transcribed Image Text:Use the information from the preceding table to fill in the following table.
Year
2020
2021
2022
Nominal GDP
(Dollars)
Real GDP
(Base year 2020, dollars) GDP Deflator
From 2021 to 2022, nominal GDP
The inflation rate in 2022 was
and real GDP
Why is real GDP a more accurate measure of an economy's production than nominal GDP?
Real GDP measures the value of the goods and services an economy produces, but nominal GDP measures the value of the goods and
services en economy consumes.
Nominal GDP is adjusted for the effects of inflation or deflaten, whereas real GDP is not.
Real GDP is not influenced by price changes, but nominal GDP is.

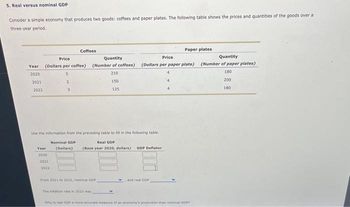
Transcribed Image Text:5. Real versus nominal GDP
Consider a simple economy that produces two goods: coffees and paper plates. The following table shows the prices and quantities of the goods over a
three-year period.
2021
2022
Price
Quantity
Price
Year (Dollars per coffee) (Number of coffees) (Dollars per paper plate)
2020
3
210
150
125
Year
2020
Use the information from the preceding table to fill in the following table
Real GDP
(Base year 2020, dollars) GDP Deflator
2021
2
2022
3
Coffees
Nominal GDP
(Dollars)
From 2021 to 2022, nominal GDP
The Inflation rate in 2022 was
Paper plates
and real GOP
Why is real GDP a more accurate measure of an economy's production than nominal GDP?
Quantity
(Number of paper plates)
180
200
180
Expert Solution
This question has been solved!
Explore an expertly crafted, step-by-step solution for a thorough understanding of key concepts.
This is a popular solution
Trending nowThis is a popular solution!
Step by stepSolved in 3 steps

Knowledge Booster
Learn more about
Need a deep-dive on the concept behind this application? Look no further. Learn more about this topic, economics and related others by exploring similar questions and additional content below.Similar questions
- An economy produces only food and fun. The table shows the quantities produced and prices in 2018 and 2019. If the base year is 2018, use the chained-dollar method to calculate real GDP in 2018 and 2019. Quest In terms of what dollars is each of these two real GDPS measured? In 2018 Item Quantity Price Real GDP in 2018 using the chained-dollar method is Food 90 $2 $4 Fun 71 $5 In 2019 Item Quantity Price Food 79 $3 Fun 68 $7 Enter your answer in the answer box and then click Check Answer. Check Answ Clear All parts remaining MacBook Air DD F11 F10 F9 F8 F7 80 F6 F5 F4 F3 F2 esc F1 & 2$ 7 8. 9 4 1 2 Y # 3arrow_forwardPlease help with the calculations.arrow_forward3. In a small community, breakfast is the most important meal of the day. Therefore, the only two goods that this community produces are coffee and scones in the following amounts: Year 2020 2021 Quantity 60 cups 90 cups Coffee Price $1.25 $1.45 Quantity 45 units 65 units Scones Price $2.10 $3.95 a) Calculate the inflation rate for 2021 using the GDP deflator method (assume that 2020 is the base year for real GDP calculations). Show your work. b) Calculate the inflation rate for 2021 using the CPI method (assume that 2020 is the base year for CPI calculations). Additionally, assume that the consumption basket for both years contains only 10 cups of coffee and 40 scones. Show your work. c) Compare the results of both inflation calculations and explain why they are similar or different based on the two methods and on the specific data used in this example.arrow_forward
- 1 a. US GDP was 14,419 billion in 2009 and 14,964 billion in 2010. What was the percentage increase in GDP over this period? Show your work. 1 b. Inflation between 2009 and 2010 was 1.2 percent. What was the approximate percentage growth in real GDP? 2. According to the Bureau of Economic Analysis in the U.S. Census Bureau, what was US GDP in 2017, in billions of current dollars? 3. Approximately when did the most recent U.S. recession occur?arrow_forwardSo far, we have learned to measure real GDP, but how do we end up with that real GDP? Of all of the different amountsof national income and price levels that might exist, how do we gravitate toward the one that gets measured each year asreal GDP?In short, it is the interaction of the buyers and producers of all output that determines both the national income (real GDP)and the price level. In other words, the intersection of aggregate demand (AD) and short-run aggregate supply (SRAS)determines the short-run equilibrium output and price level.Once we have a short-run equilibrium output, we can then compare it to the full employment output to figure out where inthe business cycle we are. If current real GDP is less than full employment output, an economy is in a recession. If currentreal GDP is higher than full employment output, an economy is experiencing a boom. If the current output is equal to thefull-employment output, then we say that the economy is in long-run equilibrium. The…arrow_forwarda. Using the following table to calculate GDP price deflator in 2021 and 2022, and the change in overall price level from 2021 to 2022 nominal GDP in 2021 was $104,000 in 2022 was $112,000 real GDP in 2021 was $84,000 and in 2022, $88,000 b. Consider an economy, only producing two good Apple and orange in both year one need to Ken the real GDP of this economy, increase between one and two, while the nominal GDP decreases or remain the same explain your answer with a numerical example Note:- Do not provide handwritten solution. Maintain accuracy and quality in your answer. Take care of plagiarism. Answer completely. You will get up vote for sure.arrow_forward
arrow_back_ios
arrow_forward_ios
Recommended textbooks for you

 Principles of Economics (12th Edition)EconomicsISBN:9780134078779Author:Karl E. Case, Ray C. Fair, Sharon E. OsterPublisher:PEARSON
 Engineering Economy (17th Edition)EconomicsISBN:9780134870069Author:William G. Sullivan, Elin M. Wicks, C. Patrick KoellingPublisher:PEARSON
 Principles of Economics (MindTap Course List)EconomicsISBN:9781305585126Author:N. Gregory MankiwPublisher:Cengage Learning
 Managerial Economics: A Problem Solving ApproachEconomicsISBN:9781337106665Author:Luke M. Froeb, Brian T. McCann, Michael R. Ward, Mike ShorPublisher:Cengage Learning
 Managerial Economics & Business Strategy (Mcgraw-...EconomicsISBN:9781259290619Author:Michael Baye, Jeff PrincePublisher:McGraw-Hill Education


Principles of Economics (12th Edition)
Economics
ISBN:9780134078779
Author:Karl E. Case, Ray C. Fair, Sharon E. Oster
Publisher:PEARSON

Engineering Economy (17th Edition)
Economics
ISBN:9780134870069
Author:William G. Sullivan, Elin M. Wicks, C. Patrick Koelling
Publisher:PEARSON

Principles of Economics (MindTap Course List)
Economics
ISBN:9781305585126
Author:N. Gregory Mankiw
Publisher:Cengage Learning

Managerial Economics: A Problem Solving Approach
Economics
ISBN:9781337106665
Author:Luke M. Froeb, Brian T. McCann, Michael R. Ward, Mike Shor
Publisher:Cengage Learning

Managerial Economics & Business Strategy (Mcgraw-...
Economics
ISBN:9781259290619
Author:Michael Baye, Jeff Prince
Publisher:McGraw-Hill Education