
Practical Management Science
6th Edition
ISBN: 9781337406659
Author: WINSTON, Wayne L.
Publisher: Cengage,
expand_more
expand_more
format_list_bulleted
Related questions
Question

Transcribed Image Text:3.
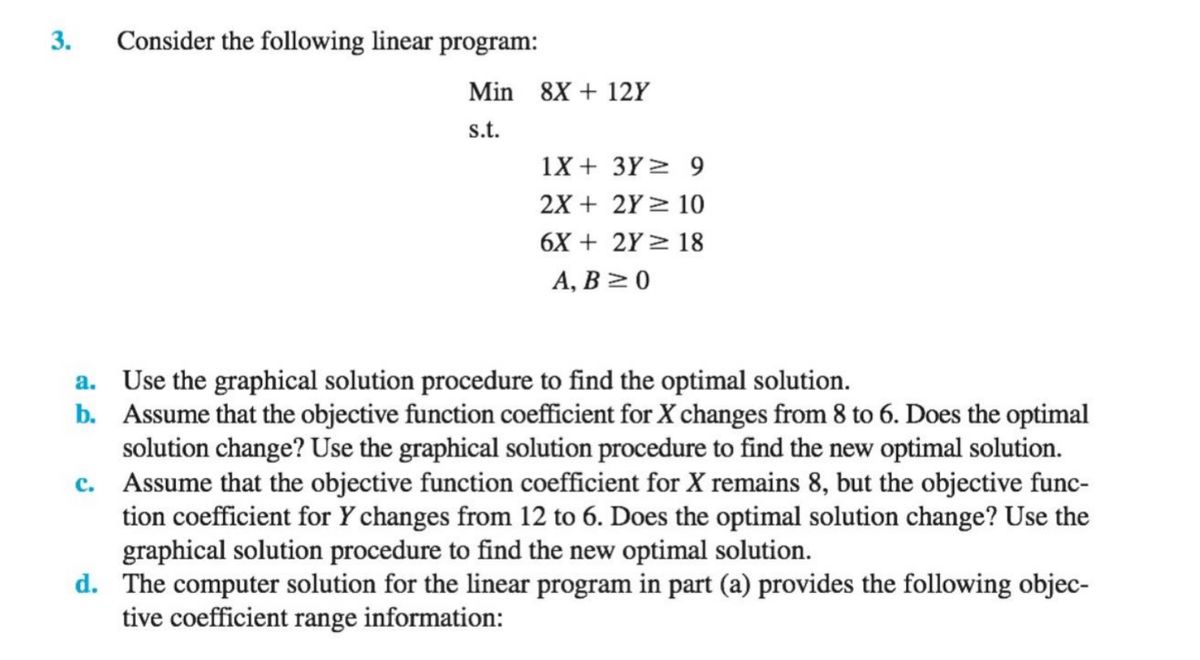
Consider the following linear program:
Min 8X + 12Y
s.t.
1X + 3Y > 9
2X + 2Y > 10
6X + 2Y > 18
А, В 2 0
a. Use the graphical solution procedure to find the optimal solution.
b. Assume that the objective function coefficient for X changes from 8 to 6. Does the optimal
solution change? Use the graphical solution procedure to find the new optimal solution.
c. Assume that the objective function coefficient for X remains 8, but the objective func-
tion coefficient for Y changes from 12 to 6. Does the optimal solution change? Use the
graphical solution procedure to find the new optimal solution.
d. The computer solution for the linear program in part (a) provides the following objec-
tive coefficient range information:
Expert Solution
This question has been solved!
Explore an expertly crafted, step-by-step solution for a thorough understanding of key concepts.

This is a popular solution

Trending nowThis is a popular solution!

Step by stepSolved in 5 steps with 11 images

Follow-up Questions
Read through expert solutions to related follow-up questions below.
Follow-up Question
Follow up for part d)

Transcribed Image Text:3.
Consider the following linear program:
Min 8X + 12Y
s.t.
1X + 3Y > 9
2X + 2Y > 10
6X + 2Y > 18
А, В 2 0
a. Use the graphical solution procedure to find the optimal solution.
b. Assume that the objective function coefficient for X changes from 8 to 6. Does the optimal
solution change? Use the graphical solution procedure to find the new optimal solution.
c. Assume that the objective function coefficient for X remains 8, but the objective func-
tion coefficient for Y changes from 12 to 6. Does the optimal solution change? Use the
graphical solution procedure to find the new optimal solution.
d. The computer solution for the linear program in part (a) provides the following objec-
tive coefficient range information:
Solution
by Bartleby Expert
Follow-up Questions
Read through expert solutions to related follow-up questions below.
Follow-up Question
Follow up for part d)
Transcribed Image Text:3.
Consider the following linear program:
Min 8X + 12Y
s.t.
1X + 3Y > 9
2X + 2Y > 10
6X + 2Y > 18
А, В 2 0
a. Use the graphical solution procedure to find the optimal solution.
b. Assume that the objective function coefficient for X changes from 8 to 6. Does the optimal
solution change? Use the graphical solution procedure to find the new optimal solution.
c. Assume that the objective function coefficient for X remains 8, but the objective func-
tion coefficient for Y changes from 12 to 6. Does the optimal solution change? Use the
graphical solution procedure to find the new optimal solution.
d. The computer solution for the linear program in part (a) provides the following objec-
tive coefficient range information:
Solution
by Bartleby Expert
Knowledge Booster

Similar questions
- Assume the demand for a companys drug Wozac during the current year is 50,000, and assume demand will grow at 5% a year. If the company builds a plant that can produce x units of Wozac per year, it will cost 16x. Each unit of Wozac is sold for 3. Each unit of Wozac produced incurs a variable production cost of 0.20. It costs 0.40 per year to operate a unit of capacity. Determine how large a Wozac plant the company should build to maximize its expected profit over the next 10 years.arrow_forwardThe Tinkan Company produces one-pound cans for the Canadian salmon industry. Each year the salmon spawn during a 24-hour period and must be canned immediately. Tinkan has the following agreement with the salmon industry. The company can deliver as many cans as it chooses. Then the salmon are caught. For each can by which Tinkan falls short of the salmon industrys needs, the company pays the industry a 2 penalty. Cans cost Tinkan 1 to produce and are sold by Tinkan for 2 per can. If any cans are left over, they are returned to Tinkan and the company reimburses the industry 2 for each extra can. These extra cans are put in storage for next year. Each year a can is held in storage, a carrying cost equal to 20% of the cans production cost is incurred. It is well known that the number of salmon harvested during a year is strongly related to the number of salmon harvested the previous year. In fact, using past data, Tinkan estimates that the harvest size in year t, Ht (measured in the number of cans required), is related to the harvest size in the previous year, Ht1, by the equation Ht = Ht1et where et is normally distributed with mean 1.02 and standard deviation 0.10. Tinkan plans to use the following production strategy. For some value of x, it produces enough cans at the beginning of year t to bring its inventory up to x+Ht, where Ht is the predicted harvest size in year t. Then it delivers these cans to the salmon industry. For example, if it uses x = 100,000, the predicted harvest size is 500,000 cans, and 80,000 cans are already in inventory, then Tinkan produces and delivers 520,000 cans. Given that the harvest size for the previous year was 550,000 cans, use simulation to help Tinkan develop a production strategy that maximizes its expected profit over the next 20 years. Assume that the company begins year 1 with an initial inventory of 300,000 cans.arrow_forwardLemingtons is trying to determine how many Jean Hudson dresses to order for the spring season. Demand for the dresses is assumed to follow a normal distribution with mean 400 and standard deviation 100. The contract between Jean Hudson and Lemingtons works as follows. At the beginning of the season, Lemingtons reserves x units of capacity. Lemingtons must take delivery for at least 0.8x dresses and can, if desired, take delivery on up to x dresses. Each dress sells for 160 and Hudson charges 50 per dress. If Lemingtons does not take delivery on all x dresses, it owes Hudson a 5 penalty for each unit of reserved capacity that is unused. For example, if Lemingtons orders 450 dresses and demand is for 400 dresses, Lemingtons will receive 400 dresses and owe Jean 400(50) + 50(5). How many units of capacity should Lemingtons reserve to maximize its expected profit?arrow_forward
- In Example 11.1, the possible profits vary from negative to positive for each of the 10 possible bids examined. a. For each of these, use @RISKs RISKTARGET function to find the probability that Millers profit is positive. Do you believe these results should have any bearing on Millers choice of bid? b. Use @RISKs RISKPERCENTILE function to find the 10th percentile for each of these bids. Can you explain why the percentiles have the values you obtain?arrow_forwardIf a monopolist produces q units, she can charge 400 4q dollars per unit. The variable cost is 60 per unit. a. How can the monopolist maximize her profit? b. If the monopolist must pay a sales tax of 5% of the selling price per unit, will she increase or decrease production (relative to the situation with no sales tax)? c. Continuing part b, use SolverTable to see how a change in the sales tax affects the optimal solution. Let the sales tax vary from 0% to 8% in increments of 0.5%.arrow_forward
arrow_back_ios
arrow_forward_ios
Recommended textbooks for you
- Practical Management ScienceOperations ManagementISBN:9781337406659Author:WINSTON, Wayne L.Publisher:Cengage,
Practical Management Science
Operations Management
ISBN:9781337406659
Author:WINSTON, Wayne L.
Publisher:Cengage,