MATLAB: An Introduction with Applications
6th Edition
ISBN: 9781119256830
Author: Amos Gilat
Publisher: John Wiley & Sons Inc
expand_more
expand_more
format_list_bulleted
Concept explainers
Question

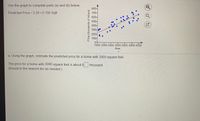
Transcribed Image Text:Use the graph to complete parts (a) and (b) below.
800-
Predicted Price 3.20 +0.150 Sqft
700-
600-
500
400-
300
200-
100-
1500 2000 2500 3000 3500 4000 4500
Area
a. Using the graph, estimate the predicted price for a home with 3000 square feet.
The price for a home with 3000 square feet is about $
thousand.
(Round to the nearest ten as needed.)
Prlce (thousands of dollars)
Expert Solution
This question has been solved!
Explore an expertly crafted, step-by-step solution for a thorough understanding of key concepts.
This is a popular solution
Trending nowThis is a popular solution!
Step by stepSolved in 2 steps

Knowledge Booster
Learn more about
Need a deep-dive on the concept behind this application? Look no further. Learn more about this topic, statistics and related others by exploring similar questions and additional content below.Similar questions
- Please answer with a neat presentation, so that it's easy to read. Also, if you can show your work so that I can see how to do the current and future problems like this. Thank you.arrow_forwardConsider the variation of temperature with altitude depicted in the graph below. What is the “y-intercept”?arrow_forwardOn the following graph, use the green point (triangle symbol) to plot the weekly total revenue when the market price is $50, $75, $100, $125, $150, $175, and $200 per scooter. TOTAL REVENUE (Dollars) 2610 2430 2250 2070 1800 1710 1530 1350 1170 990 0 25 50 75 100 125 150 175 200 225 250 275 300 325 PRICE (Dollars per scooter) Total Revenue ? According to the midpoint method, the price elasticity of demand between points A and B is approximately 0.69 Suppose the price of scooters is currently $125 per scooter, shown as point A on the initial graph. Because the demand between points A and B is Inelastica $25-per-scooter decrease in price will lead to a decrease in total revenue per week. In general, in order for a price decrease to cause a decrease in total revenue, demand must be Inelasticarrow_forward
arrow_back_ios
arrow_forward_ios
Recommended textbooks for you
 MATLAB: An Introduction with ApplicationsStatisticsISBN:9781119256830Author:Amos GilatPublisher:John Wiley & Sons Inc
 Probability and Statistics for Engineering and th...StatisticsISBN:9781305251809Author:Jay L. DevorePublisher:Cengage Learning
 Statistics for The Behavioral Sciences (MindTap C...StatisticsISBN:9781305504912Author:Frederick J Gravetter, Larry B. WallnauPublisher:Cengage Learning
 Elementary Statistics: Picturing the World (7th E...StatisticsISBN:9780134683416Author:Ron Larson, Betsy FarberPublisher:PEARSON
 The Basic Practice of StatisticsStatisticsISBN:9781319042578Author:David S. Moore, William I. Notz, Michael A. FlignerPublisher:W. H. Freeman
 Introduction to the Practice of StatisticsStatisticsISBN:9781319013387Author:David S. Moore, George P. McCabe, Bruce A. CraigPublisher:W. H. Freeman

MATLAB: An Introduction with Applications
Statistics
ISBN:9781119256830
Author:Amos Gilat
Publisher:John Wiley & Sons Inc

Probability and Statistics for Engineering and th...
Statistics
ISBN:9781305251809
Author:Jay L. Devore
Publisher:Cengage Learning

Statistics for The Behavioral Sciences (MindTap C...
Statistics
ISBN:9781305504912
Author:Frederick J Gravetter, Larry B. Wallnau
Publisher:Cengage Learning

Elementary Statistics: Picturing the World (7th E...
Statistics
ISBN:9780134683416
Author:Ron Larson, Betsy Farber
Publisher:PEARSON

The Basic Practice of Statistics
Statistics
ISBN:9781319042578
Author:David S. Moore, William I. Notz, Michael A. Fligner
Publisher:W. H. Freeman

Introduction to the Practice of Statistics
Statistics
ISBN:9781319013387
Author:David S. Moore, George P. McCabe, Bruce A. Craig
Publisher:W. H. Freeman