Calculus: Early Transcendentals
8th Edition
ISBN: 9781285741550
Author: James Stewart
Publisher: Cengage Learning
expand_more
expand_more
format_list_bulleted
Question
thumb_up100%
Please guide me to the correct answer.
![### Transcription for Educational Website
**Submitted Answers Table:**
| Entered | Answer Preview | Result |
|---------|----------------|-----------|
| 2 | 2 | incorrect |
| A | A | incorrect |
**Feedback:**
*At least one of the answers above is NOT correct.*
**Instructions:**
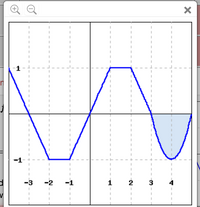
Use the graph of \( f(x) \) in the figure to find the following integrals.
**A.** \[
\int_{-3}^{0} f(x) \, dx = 2
\]
**B.** If the blue shaded area in the graph has area \( A \), find the value of the following integral in terms of \( A \).
\[
\int_{-3}^{5} f(x) \, dx = A
\]
**Graph Description:**
- The graph on the right is labeled "Graph of \( y = f(x) \)."
- It includes a blue line that depicts the function \( f(x) \).
- The x-axis ranges approximately from -5 to 5, and the y-axis from -1.5 to 1.5.
- A section of the graph between x = 4 and x = 5 is shaded in blue, indicating an area related to the variable \( A \).](https://content.bartleby.com/qna-images/question/30c87a43-7b2c-40fe-85f1-990c225cb51e/f25c04d4-343d-4145-9f16-93f6c51849d1/h006d9d_thumbnail.png)
Transcribed Image Text:### Transcription for Educational Website
**Submitted Answers Table:**
| Entered | Answer Preview | Result |
|---------|----------------|-----------|
| 2 | 2 | incorrect |
| A | A | incorrect |
**Feedback:**
*At least one of the answers above is NOT correct.*
**Instructions:**
Use the graph of \( f(x) \) in the figure to find the following integrals.
**A.** \[
\int_{-3}^{0} f(x) \, dx = 2
\]
**B.** If the blue shaded area in the graph has area \( A \), find the value of the following integral in terms of \( A \).
\[
\int_{-3}^{5} f(x) \, dx = A
\]
**Graph Description:**
- The graph on the right is labeled "Graph of \( y = f(x) \)."
- It includes a blue line that depicts the function \( f(x) \).
- The x-axis ranges approximately from -5 to 5, and the y-axis from -1.5 to 1.5.
- A section of the graph between x = 4 and x = 5 is shaded in blue, indicating an area related to the variable \( A \).

Transcribed Image Text:This graph depicts a piecewise function. The x-axis ranges from -4 to 5, while the y-axis ranges from -2 to 2.
### Function Description:
- The graph is sectioned into two main parts:
- A linear segment from x = -3 to x = -1
- A sinusoidal curve from x = -1 to x = 4
### Graph Details:
- **Linear Segment**:
- From x = -3 to x = -1, the graph shows a V-shaped pattern with a minimum point at (-2, -1).
- This section forms a sharp angle at (-1, 1) before transitioning into the sinusoidal section.
- **Sinusoidal Curve**:
- Begins at x = -1 and continues to x = 4, exhibiting typical wave-like properties.
- There is a maximum point at (1, 1) and a minimum point at (4, -1).
- The curve reaches another peak slightly above y = 1 before starting a descending pattern.
### Shaded Area:
- There is a shaded region under the curve between x = 3 and x = 4, indicating an area of interest, possibly for integration or other analyses.
This graph can be used to illustrate the behavior of piecewise and sinusoidal functions, their maxima and minima, and the concept of definite integration over a specified area.
Expert Solution
This question has been solved!
Explore an expertly crafted, step-by-step solution for a thorough understanding of key concepts.
This is a popular solution
Trending nowThis is a popular solution!
Step by stepSolved in 3 steps with 1 images

Knowledge Booster
Similar questions
- please this answer is wrong. kindly do not respond to my question with this same answer. thanksarrow_forwardi have to explain each answer. can you help me understand each answer?arrow_forwardCan you check and make sure this is correct? If not show me the answer and how it was done pleasearrow_forward
arrow_back_ios
arrow_forward_ios
Recommended textbooks for you
 Calculus: Early TranscendentalsCalculusISBN:9781285741550Author:James StewartPublisher:Cengage Learning
 Thomas' Calculus (14th Edition)CalculusISBN:9780134438986Author:Joel R. Hass, Christopher E. Heil, Maurice D. WeirPublisher:PEARSON
 Calculus: Early Transcendentals (3rd Edition)CalculusISBN:9780134763644Author:William L. Briggs, Lyle Cochran, Bernard Gillett, Eric SchulzPublisher:PEARSON
 Calculus: Early TranscendentalsCalculusISBN:9781319050740Author:Jon Rogawski, Colin Adams, Robert FranzosaPublisher:W. H. Freeman
 Calculus: Early Transcendental FunctionsCalculusISBN:9781337552516Author:Ron Larson, Bruce H. EdwardsPublisher:Cengage Learning

Calculus: Early Transcendentals
Calculus
ISBN:9781285741550
Author:James Stewart
Publisher:Cengage Learning

Thomas' Calculus (14th Edition)
Calculus
ISBN:9780134438986
Author:Joel R. Hass, Christopher E. Heil, Maurice D. Weir
Publisher:PEARSON

Calculus: Early Transcendentals (3rd Edition)
Calculus
ISBN:9780134763644
Author:William L. Briggs, Lyle Cochran, Bernard Gillett, Eric Schulz
Publisher:PEARSON

Calculus: Early Transcendentals
Calculus
ISBN:9781319050740
Author:Jon Rogawski, Colin Adams, Robert Franzosa
Publisher:W. H. Freeman


Calculus: Early Transcendental Functions
Calculus
ISBN:9781337552516
Author:Ron Larson, Bruce H. Edwards
Publisher:Cengage Learning