
ENGR.ECONOMIC ANALYSIS
14th Edition
ISBN: 9780190931919
Author: NEWNAN
Publisher: Oxford University Press
expand_more
expand_more
format_list_bulleted
Related questions
Question
Respond to the question with a concise and accurate answer, along with a clear explanation and step-by-step solution, or risk receiving a downvote.
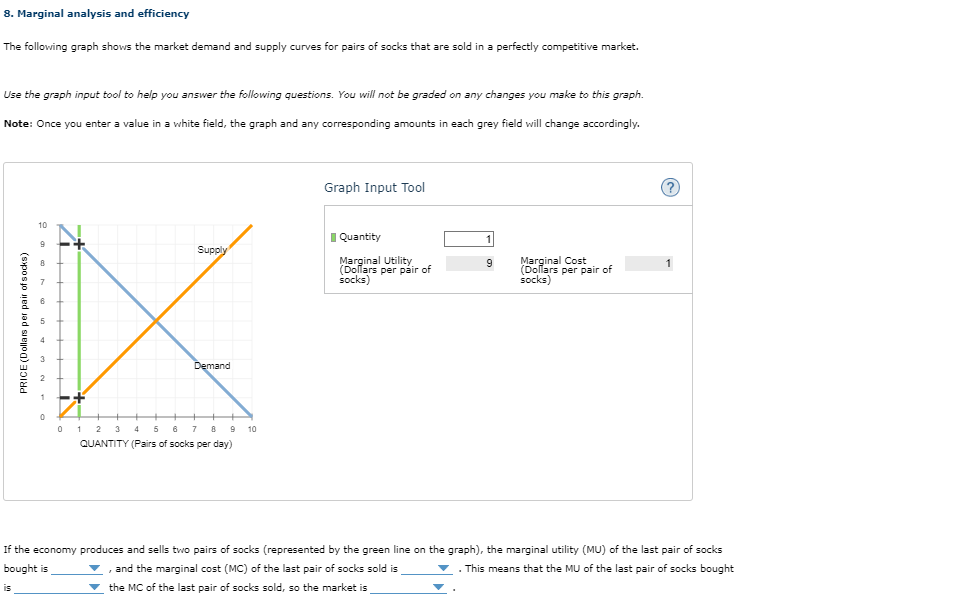

Transcribed Image Text:8. Marginal analysis and efficiency
The following graph shows the market demand and supply curves for pairs of socks that are sold in a perfectly competitive market.
Use the graph input tool to help you answer the following questions. You will not be graded on any changes you make to this graph.
Note: Once you enter a value in a white field, the graph and any corresponding amounts in each grey field will change accordingly.
PRICE (Dollars per pair of socks)
is
10
9
8
bo
0
Supply
Demand
0 1 2 3 4 5 6 7 8
QUANTITY (Pairs of socks per day)
9 10
Graph Input Tool
Quantity
Marginal Utility
(Dollars per pair of
socks)
1
9
Marginal Cost
(Dollars per pair of
socks)
(?)
1
If the economy produces and sells two pairs of socks (represented by the green line on the graph), the marginal utility (MU) of the last pair of socks
bought is
and the marginal cost (MC) of the last pair of socks sold is
. This means that the MU of the last pair of socks bought
the MC of the last pair of socks sold, so the market is
Expert Solution
This question has been solved!
Explore an expertly crafted, step-by-step solution for a thorough understanding of key concepts.

This is a popular solution

Trending nowThis is a popular solution!

Step by stepSolved in 4 steps

Knowledge Booster


Learn more about
Need a deep-dive on the concept behind this application? Look no further. Learn more about this topic, economics and related others by exploring similar questions and additional content below.Similar questions
- A framing effect occurs when a choice is affected by how information about an item is presented. True Falsearrow_forwardOften, making fully mathematically rational decisions is impossible because of the reality we exist in. True Falsearrow_forwardEconomics CHOOSE THE CORRECT ANSWER. Remember that in the equilibrium prediction of an ultimatum game, the Proposer will offer the smallest non-zero amount of money possible. First-year Commerce students were asked to play an Ultimatum game where a choice had to be made over the division of R100. Offers could only be made in R10 increments, and the results of the various offers made are reported in the table below. Amount offered by Proposer RO R10 R20 R30 R40 R50 Proportion rejected 100% 60% 50% 30% 10% 0% What is the equilibrium split of the R100 between the Proposer and the Responder? O A. Proposer: R50, Responder: R50 O B. Proposer: R10, Responder: R90 O C. Proposer: R90, Responder: R10 O D. Proposer: R60, Responder: R40 O E. Proposer: R40, Responder: R60arrow_forward
- To what extent do ethical norms reflect a company’s dedication to the Triple Bottom Line?arrow_forwardAs an employer, suppose you find it costly to monitor employee effort 100 percent of the time. What compensation options, in terms of the basis of pay, are available to ensure that you get appropriate levels of employee effort? What factors would you consider in choosing among these options?arrow_forwardImagine that you own one of several popular restaurants in your area. Due to the Covid Pandemic of 2020, all restaurants were forced to close down for two months. You are now allowed to reopen your restaurant to the public. During this time, labor costs were reduced however, overhead such as rent, electricity, etc. was still a large percentage of your total costs. You are facing a dilemma; you are short on funds. What options should you consider? For example, should you raise menu prices to make up for the lost revenue? Should you lower menu prices to attract more customers? Is your customer volume elastic? If you raise prices and the customer volume falls will the increase in prices compensate for the loss of volume? If it does not, is there some way you can make up the revenue shortfall? If you lower menu prices and revenue falls is there some way you can increase your business revenue? Explain your reasoning in terms of demand and elasticity.arrow_forward
- Why is cost-minimization analysis most likely to be useful for managers?arrow_forwardMarket price is always more than factor cost. True /Falsearrow_forwardPrice matching is a strategic move that A- seeks to make cheating unprofitable. B- must generally be announced publicly in order to have the desired effect. C- has no usefulness to managers if a simultaneous pricing decision is going to be made only one time. D- both a and b E- all of the abovearrow_forward
- You own a company that produces helmets. You are currently selling 100 helmets per week. Your average total cost of producing these helmets is $100. Recall ATC=TC/Q. A customer comes to your store and says he needs a helmet and will pay you $95 for it. Thus you need to produce the 101st helmet if you make the sale. Your average total cost if you produce 101 helmets is $99.95. Do you sell the helmet to the customer for $95?arrow_forwardWhich one applies to an impatient individual? Have high discount factors Have low discount rates More likely to become a physician More likely to become a surferarrow_forwardA personal economic decision that was driven by a behavioral bias rather than by pure rational behavior.arrow_forward
arrow_back_ios
SEE MORE QUESTIONS
arrow_forward_ios
Recommended textbooks for you
 Principles of Economics (12th Edition)EconomicsISBN:9780134078779Author:Karl E. Case, Ray C. Fair, Sharon E. OsterPublisher:PEARSON
 Engineering Economy (17th Edition)EconomicsISBN:9780134870069Author:William G. Sullivan, Elin M. Wicks, C. Patrick KoellingPublisher:PEARSON
 Principles of Economics (MindTap Course List)EconomicsISBN:9781305585126Author:N. Gregory MankiwPublisher:Cengage Learning
 Managerial Economics: A Problem Solving ApproachEconomicsISBN:9781337106665Author:Luke M. Froeb, Brian T. McCann, Michael R. Ward, Mike ShorPublisher:Cengage Learning
 Managerial Economics & Business Strategy (Mcgraw-...EconomicsISBN:9781259290619Author:Michael Baye, Jeff PrincePublisher:McGraw-Hill Education
Principles of Economics (12th Edition)
Economics
ISBN:9780134078779
Author:Karl E. Case, Ray C. Fair, Sharon E. Oster
Publisher:PEARSON
Engineering Economy (17th Edition)
Economics
ISBN:9780134870069
Author:William G. Sullivan, Elin M. Wicks, C. Patrick Koelling
Publisher:PEARSON
Principles of Economics (MindTap Course List)
Economics
ISBN:9781305585126
Author:N. Gregory Mankiw
Publisher:Cengage Learning
Managerial Economics: A Problem Solving Approach
Economics
ISBN:9781337106665
Author:Luke M. Froeb, Brian T. McCann, Michael R. Ward, Mike Shor
Publisher:Cengage Learning
Managerial Economics & Business Strategy (Mcgraw-...
Economics
ISBN:9781259290619
Author:Michael Baye, Jeff Prince
Publisher:McGraw-Hill Education