
ENGR.ECONOMIC ANALYSIS
14th Edition
ISBN: 9780190931919
Author: NEWNAN
Publisher: Oxford University Press
expand_more
expand_more
format_list_bulleted
Related questions
Question
Hi hlo Expert pro Hand written solution is not allowed.
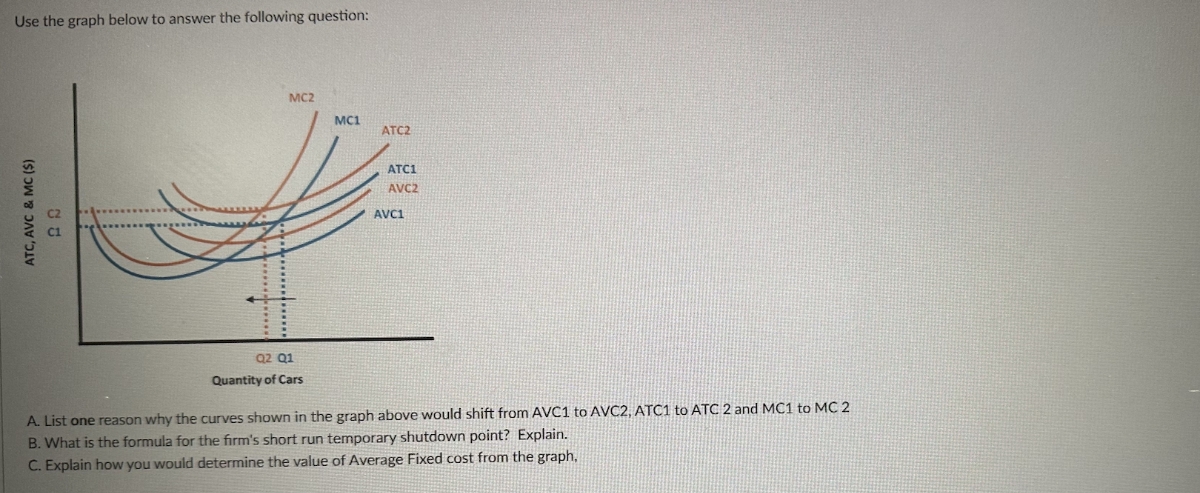

Transcribed Image Text:Use the graph below to answer the following question:
ATC, AVC & MC ($)
20
MC2
MC1
ATC2
ATC1
AVC2
AVC1
Q2 Q1
Quantity of Cars
A. List one reason why the curves shown in the graph above would shift from AVC1 to AVC2, ATC1 to ATC 2 and MC1 to MC 2
B. What is the formula for the firm's short run temporary shutdown point? Explain.
C. Explain how you would determine the value of Average Fixed cost from the graph,
Expert Solution
This question has been solved!
Explore an expertly crafted, step-by-step solution for a thorough understanding of key concepts.

This is a popular solution

Trending nowThis is a popular solution!

Step by stepSolved in 2 steps

Knowledge Booster

Similar questions
- Nonearrow_forwardThe future value of 1000 Rand for 8% interest rate over 6 years is a certain value. At what interest rate will you get the same future value when you change the period to 3 years for the same 1000 Rand? Hint use goal seekarrow_forwardwhat are the numbers that go in the cost table A through L Note:- Do not provide handwritten solution. Maintain accuracy and quality in your answer. Take care of plagiarism. Answer completely. You will get up vote for sure.arrow_forward
- PLS HELP ASAP ON BOTHarrow_forwardGiven the following information for an insurance company that writes 24-month term policies: Number of Vehicles 50 100 Policy Group A B Effective Date January 1, 2010 Expiration Date December 31, 2011 July 1, 2010 June 30, 2012 All policies within each group have the same effective date. (a) Calculate the earned car-years for calendar year 2011. (b) Calculate the earned car-years for policy year 2010 evaluated as of December 31, 2010 and as of December 31, 2011. (c) Assume Policy Group B cancels on January 1, 2011. Calculate the 2010 policy year written car- years evaluated as of December 31, 2010 and as of December 31, 2011 for Policy Group B. (d) Assume Policy Group B cancels on July 1, 2011. Calculate the 2010 and 2011 calendar year written car-years for Policy Group B.arrow_forward
arrow_back_ios
arrow_forward_ios
Recommended textbooks for you
 Principles of Economics (12th Edition)EconomicsISBN:9780134078779Author:Karl E. Case, Ray C. Fair, Sharon E. OsterPublisher:PEARSON
 Engineering Economy (17th Edition)EconomicsISBN:9780134870069Author:William G. Sullivan, Elin M. Wicks, C. Patrick KoellingPublisher:PEARSON
 Principles of Economics (MindTap Course List)EconomicsISBN:9781305585126Author:N. Gregory MankiwPublisher:Cengage Learning
 Managerial Economics: A Problem Solving ApproachEconomicsISBN:9781337106665Author:Luke M. Froeb, Brian T. McCann, Michael R. Ward, Mike ShorPublisher:Cengage Learning
 Managerial Economics & Business Strategy (Mcgraw-...EconomicsISBN:9781259290619Author:Michael Baye, Jeff PrincePublisher:McGraw-Hill Education
Principles of Economics (12th Edition)
Economics
ISBN:9780134078779
Author:Karl E. Case, Ray C. Fair, Sharon E. Oster
Publisher:PEARSON
Engineering Economy (17th Edition)
Economics
ISBN:9780134870069
Author:William G. Sullivan, Elin M. Wicks, C. Patrick Koelling
Publisher:PEARSON
Principles of Economics (MindTap Course List)
Economics
ISBN:9781305585126
Author:N. Gregory Mankiw
Publisher:Cengage Learning
Managerial Economics: A Problem Solving Approach
Economics
ISBN:9781337106665
Author:Luke M. Froeb, Brian T. McCann, Michael R. Ward, Mike Shor
Publisher:Cengage Learning
Managerial Economics & Business Strategy (Mcgraw-...
Economics
ISBN:9781259290619
Author:Michael Baye, Jeff Prince
Publisher:McGraw-Hill Education