
MATLAB: An Introduction with Applications
6th Edition
ISBN: 9781119256830
Author: Amos Gilat
Publisher: John Wiley & Sons Inc
expand_more
expand_more
format_list_bulleted
Related questions
Concept explainers
Question
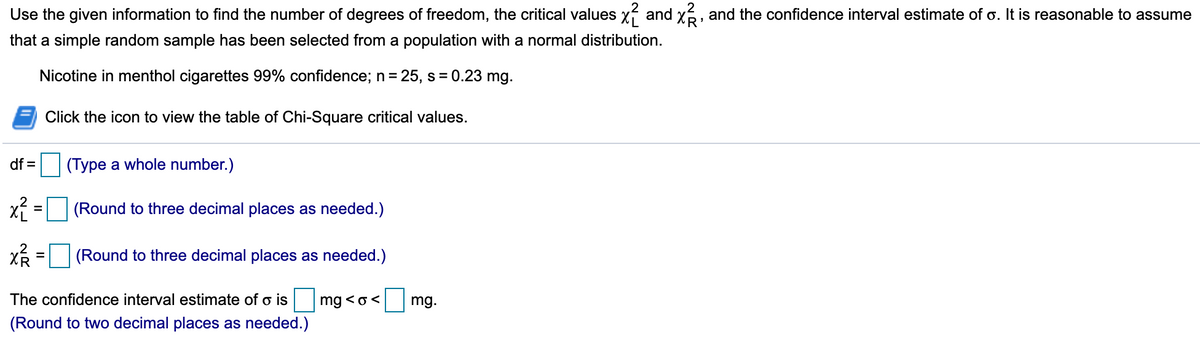

Transcribed Image Text:Use the given information to find the number of degrees of freedom, the critical values xf and x6, and the confidence interval estimate of o. It is reasonable to assume
that a simple random sample has been selected from a population with a normal distribution.
Nicotine in menthol cigarettes 99% confidence; n = 25, s = 0.23 mg.
Click the icon to view the table of Chi-Square critical values.
df =
|(Type a whole number.)
(Round to three decimal places as needed.)
(Round to three decimal places as needed.)
The confidence interval estimate of o is mg <o<
|mg.
(Round to two decimal places as needed.)
Expert Solution
This question has been solved!
Explore an expertly crafted, step-by-step solution for a thorough understanding of key concepts.

This is a popular solution

Trending nowThis is a popular solution!

Step by stepSolved in 4 steps with 4 images

Knowledge Booster


Learn more about
Need a deep-dive on the concept behind this application? Look no further. Learn more about this topic, statistics and related others by exploring similar questions and additional content below.Similar questions
- You intend to estimate a population mean with a confidence interval. You believe the population to have a normal distribution. Your sample size is 8. While it is an uncommon confidence level, find the critical value that corresponds to a confidence level of 93.5%.arrow_forwardA taxi cab company takes a random sample of 50 of its taxis and notes their miles per gallon (mpg) on a test run. The computer output is shown below. Mean St Dev Min Q1 Q2 Q3 Max 19.78 3.09 13.30 17.80 20.00 21.83 26.00 50% of the taxis have MPG lower than what value? Group of answer choices A. 20 MPG B. (21.83 - 17.80) MPG C. 19.78 MPG D. (26-13.30)/2 MPGarrow_forwardWhich confidence interval would lead you to Fail to Reject H0? Group of answer choices Test value: 10 Confidence Interval: 13.1 – 15.1 Test value: 5 Confidence Interval: 5.6 – 6.9 Test value: 5 Confidence Interval: 4.5 – 6.3 Test value: 10 Confidence Interval: 9.2 – 9.8arrow_forward
- Round correctly. Thank you.arrow_forwardK Large samples of women and men are obtained, and the hemoglobin level is measured in each subject. Here is the 95% confidence interval for the difference between the two population means, where the measures from women correspond to population 1 and the measures from men correspond to population 2: -1.76 g/dLarrow_forwardA developmental psychologist believes that children’s self-esteem scores change with age. She measures N=8 children’s self-esteem in 3rd grade and again in 6th. Evaluate the results of her data using α = .052tail. **Attached Image** a. Show how the 95% confidence interval was calculated. b. State the conclusion in APA format. c. What is Cohen’s d?arrow_forward
- You intend to estimate a population mean with a confidence interval. You believe the population to have a normal distribution. Your sample size is 8.Find the critical value that corresponds to a confidence level of 99%.arrow_forwardA population of scores has a mean of µ=89, a median of 87 and a mode of 85. What is the most likely shape for the population distribution? Symmetrical Positively skewed Negative skewed It cannot be determined from the information given O Oarrow_forwardResearchers studied the mean egg length (in millimeters) for a bird population. After taking a random sample of eggs, they obtained a 95% confidence interval of (45,60). What is the value of the margin of error? Choose the correct answer below. A. 15 mm B. 52.5 mm O c. 7.5 mm O D. 1.96arrow_forward
arrow_back_ios
arrow_forward_ios
Recommended textbooks for you
- MATLAB: An Introduction with ApplicationsStatisticsISBN:9781119256830Author:Amos GilatPublisher:John Wiley & Sons Inc
 Probability and Statistics for Engineering and th...StatisticsISBN:9781305251809Author:Jay L. DevorePublisher:Cengage Learning
 Statistics for The Behavioral Sciences (MindTap C...StatisticsISBN:9781305504912Author:Frederick J Gravetter, Larry B. WallnauPublisher:Cengage Learning
  Elementary Statistics: Picturing the World (7th E...StatisticsISBN:9780134683416Author:Ron Larson, Betsy FarberPublisher:PEARSON
 The Basic Practice of StatisticsStatisticsISBN:9781319042578Author:David S. Moore, William I. Notz, Michael A. FlignerPublisher:W. H. Freeman
 Introduction to the Practice of StatisticsStatisticsISBN:9781319013387Author:David S. Moore, George P. McCabe, Bruce A. CraigPublisher:W. H. Freeman
MATLAB: An Introduction with Applications
Statistics
ISBN:9781119256830
Author:Amos Gilat
Publisher:John Wiley & Sons Inc
Probability and Statistics for Engineering and th...
Statistics
ISBN:9781305251809
Author:Jay L. Devore
Publisher:Cengage Learning
Statistics for The Behavioral Sciences (MindTap C...
Statistics
ISBN:9781305504912
Author:Frederick J Gravetter, Larry B. Wallnau
Publisher:Cengage Learning
Elementary Statistics: Picturing the World (7th E...
Statistics
ISBN:9780134683416
Author:Ron Larson, Betsy Farber
Publisher:PEARSON
The Basic Practice of Statistics
Statistics
ISBN:9781319042578
Author:David S. Moore, William I. Notz, Michael A. Fligner
Publisher:W. H. Freeman
Introduction to the Practice of Statistics
Statistics
ISBN:9781319013387
Author:David S. Moore, George P. McCabe, Bruce A. Craig
Publisher:W. H. Freeman