
MATLAB: An Introduction with Applications
6th Edition
ISBN: 9781119256830
Author: Amos Gilat
Publisher: John Wiley & Sons Inc
expand_more
expand_more
format_list_bulleted
Related questions
Question

Transcribed Image Text:+ X²²
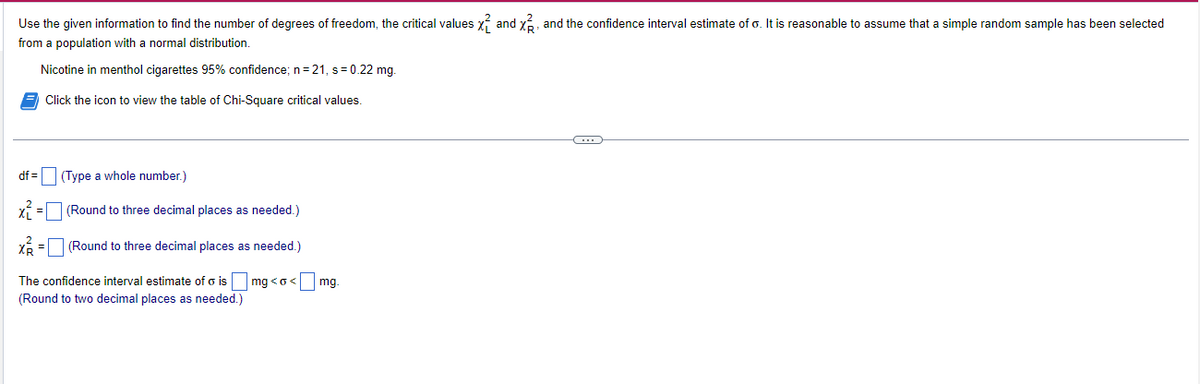
and the confidence interval estimate of o. It is reasonable to assume that a simple random sample has been selected
Use the given information to find the number of degrees of freedom, the critical values X₁ and
from a population with a normal distribution.
Nicotine in menthol cigarettes 95% confidence; n = 21, s = 0.22 mg.
Click the icon to view the table of Chi-Square critical values.
df =
(Type a whole number.)
x² = [
(Round to three decimal places as needed.)
X =
(Round to three decimal places as needed.)
The confidence interval estimate of ois mg<o< mg.
(Round to two decimal places as needed.)
C
Expert Solution
This question has been solved!
Explore an expertly crafted, step-by-step solution for a thorough understanding of key concepts.

Step by stepSolved in 2 steps with 1 images

Knowledge Booster

Similar questions
- Find the critical value t, for the confidence level c=0.80 and sample size n=22. Click the icon to view the t-distribution table. tents t = |(Round to the nearest thousandth as needed.) Resour uccessarrow_forwardTina catches a 14-pound bass. She does not know the population mean or standard deviation. So she takes a sample of five friends and they say the last bass they caught was 9, 12, 13, 10, and 10 pounds. Find the t and calculate a 95% (α = .05) confidence interval.arrow_forwardAssume that we want to construct a confidence interval. Do one of the following, as appropriate: (a) find the critical value tα/2, (b) find the critical value zα/2, or (c) state that neither the normal distribution nor the t distribution applies. Here are summary statistics for randomly selected weights of newborn girls: n=236, x=31.6 hg, s=6.9 hg. The confidence level is 90%.arrow_forward
- Find the critical value t, for the confidence level c = 0.99 and sample size n = 20. Click the icon to view the t-distribution table. ...... (Round to the nearest thousandth as needed.)arrow_forwardAssume that we want to construct a confidence interval. Do one of the following, as appropriate: (a) find the critical value to/2, (b) find the critical value Za/2, or (c) state that neither the normal distribution nor the t distribution applies. Here are summary statistics for randomly selected weights of newborn girls: n=287, x= 29.9 hg, s= 6.8 hg. The confidence level is 90%. Select the correct choice below and, if necessary, fill in the answer box to complete your choice. OA. ta/2= OB. (Round to two decimal places as needed.) Zα/2 (Round to two decimal places as needed.) OC. Neither the normal distribution nor the t distribution applies.arrow_forwardWhat is one property of a stationary time series? Question 23 options: The datapoints demonstrate a clear seasonal pattern The mean remains constant over time It is plotted as a straight horizontal line It demonstrates an upward trendarrow_forward
- Researchers studied the mean egg length (in millimeters) for a bird population. After taking a random sample of eggs, they obtained a 95% confidence interval of (45,60). What is the value of the margin of error? Choose the correct answer below. A. 15 mm B. 52.5 mm O c. 7.5 mm O D. 1.96arrow_forwardAssume that we want to construct a confidence interval. Do one of the following, as appropriate: (a) find the critical value t,/2, (b) find the critical value z, 12, or (c) state that neither the normal distribution nor the t distribution applies. Here are summary statistics for randomly selected weights of newborn girls: n = 152, x = 31.1 hg, s= 6.2 hg. The confidence level is 95%. Select the correct choice below and, if necessary, fill in the answer box to complete your choice. O A. ta/2= (Round to two decimal places as needed.) В. Za12 (Round to two decimal places as needed.) C. Neither the normal distribution nor the t distribution applies.arrow_forward
arrow_back_ios
arrow_forward_ios
Recommended textbooks for you
- MATLAB: An Introduction with ApplicationsStatisticsISBN:9781119256830Author:Amos GilatPublisher:John Wiley & Sons Inc
 Probability and Statistics for Engineering and th...StatisticsISBN:9781305251809Author:Jay L. DevorePublisher:Cengage Learning
 Statistics for The Behavioral Sciences (MindTap C...StatisticsISBN:9781305504912Author:Frederick J Gravetter, Larry B. WallnauPublisher:Cengage Learning
  Elementary Statistics: Picturing the World (7th E...StatisticsISBN:9780134683416Author:Ron Larson, Betsy FarberPublisher:PEARSON
 The Basic Practice of StatisticsStatisticsISBN:9781319042578Author:David S. Moore, William I. Notz, Michael A. FlignerPublisher:W. H. Freeman
 Introduction to the Practice of StatisticsStatisticsISBN:9781319013387Author:David S. Moore, George P. McCabe, Bruce A. CraigPublisher:W. H. Freeman
MATLAB: An Introduction with Applications
Statistics
ISBN:9781119256830
Author:Amos Gilat
Publisher:John Wiley & Sons Inc
Probability and Statistics for Engineering and th...
Statistics
ISBN:9781305251809
Author:Jay L. Devore
Publisher:Cengage Learning
Statistics for The Behavioral Sciences (MindTap C...
Statistics
ISBN:9781305504912
Author:Frederick J Gravetter, Larry B. Wallnau
Publisher:Cengage Learning
Elementary Statistics: Picturing the World (7th E...
Statistics
ISBN:9780134683416
Author:Ron Larson, Betsy Farber
Publisher:PEARSON
The Basic Practice of Statistics
Statistics
ISBN:9781319042578
Author:David S. Moore, William I. Notz, Michael A. Fligner
Publisher:W. H. Freeman
Introduction to the Practice of Statistics
Statistics
ISBN:9781319013387
Author:David S. Moore, George P. McCabe, Bruce A. Craig
Publisher:W. H. Freeman